A choropleth map uses colour coding to indicate quantitative values across geographical areas on a map.
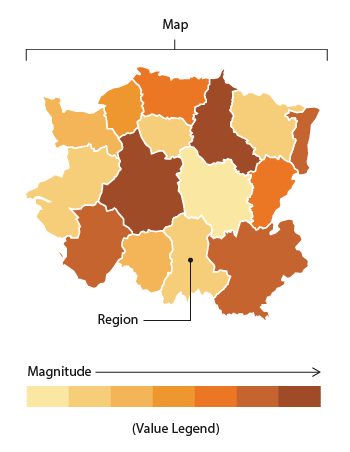
A choropleth map is a type of thematic map in which areas are shaded or patterned in proportion to a statistical variable that represents an aggregate summary of a geographic characteristic within each area, such as population density or per-capita income.
Plotly is a technical computing company that develops online data analytics and visualization tools. Plotly provides online graphing, analytics, and statistics tools for individuals and collaboration, as well as scientific graphing libraries for Python, R, MATLAB, Perl, Julia, Arduino, and REST.
An interactive, open-source, and browser-based graphing library for Python.
$ pip install plotlyPlotly Express is a new high-level Python visualization library: it's a wrapper for Plotly.py that exposes a simple syntax for complex charts.
An open standard format designed for representing simple geographical features, along with their non-spatial attributes.
An open source mapping platform for custom designed maps.