(Project can be found at: http://www.inertia7.com/projects/iris-classification-r)
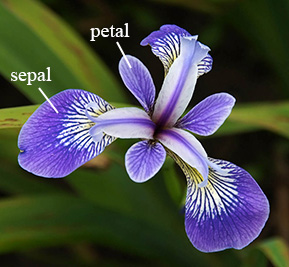
This project focuses on the classification of iris flowers into their respective species by using the K-Nearest Neighbors machine-learning algorithm. The three species in this classification problem include setosa, versicolor, and virginica. The explanatory variables include sepal length, sepal width, pedal length, petal width. See sepal wiki. See petal wiki. We are essentially trying to predict the species of the iris flower based on physical features!
The K-Nearest Neighbor algorithm is interesting because it is a simple yet powerful a machine learning method used for classification. It predicts based on majority votes, measuring a certain number of neighboring observation points (k) and classifies based on attribute prevalence using Euclidean distance.
- Raul Eulogio
- Kim Specht
- David A. Campos
Here are the required packages which will ensure all the code will run properly.
data.table
ggplot2
ggfortify
caret
class
gridExtra
GGally
RGraphics
gmodels
To make sure you have the packages we use in this project use the command(you will only have to use this once):
install.packages("packageName")
You will have now downloaded the package so within your script you run:
require(packageName)
This must be done before each Rstudio session, and written at the start of every script to ensure your code will be easily reproducible!
If you would like to publish the plots you created through this project please refer to the Forecasting the Stock Market repository (found here: https://github.com/inertia7/timeSeries_sp500_R/blob/master/README.md#steps-required)
Once the preliminary process of ensure your Rstudio has all parameters to ensure the code will run smoothly we suggest create an appropriate directory. For those using git we recommend using the following line on a terminal:
git clone git@github.com:wH4teVr folder-name
But if you are doing it manually you choose the "Clone or download" button and choose "Download ZIP". From here you must take note of where the file is downloaded, once you are able to find the file location you must set the appropriate working directory.
For this example we set the file into "/user/home/myProjects/classificationIris" so recall we have to set the working directory in Rstudio or you will receive errors especially when trying to read in the csv file. Therefore you run at the stop of your script: For linux:
setwd("/user/home/myProjects/classificationIris")
For windows(Important when finding directorys you will have):
C:\home\myDocuments\myProjects\classificationIris
Which will give you an error (since R considers "" as an escape code, the correct form is:
setwd("C:/home/myDocuments/myProjects/classificationIris")
Once you have done this you can read the csv file which contains the S&P 500 closing values for which we did our analysis on, and you can proceed to the classification method done through R!
For this project we are using an algorithm known as K-th Nearest Neighbor or k-NN. We divide the data set into two components.
- Training Set - This component is used to train the algorithm to discover predicitve relationships between the dependent variables and independent variable. In our example we used 75% of the data set (chosen randomly).
- Test Set - This component is what is left out of the algorithm and used to asses how well our k-NN performs on data it hasn't seen yet. In our case the rest of the data set, so the 25% that was not chosen to be in the training set
We went about using the iris data set, which is arguably the most used dataset with respect to statistical learning. As well as an easy data set to demonstrate the effectiveness of Classification and Machine Learning. In order to understand our procedure, it would be helpful to understand the properties we are using to predict using K-th Nearest Neighbor algorithm.
Here we have a picture referencing the Sepal and the Petal, within our dataset we are using the length and width of each component to try to predict the species of the Iris flower.
In this data set there are three species; Iris Setosa. Iris Virginica, and Iris Versicolor. Our goal is to try to predict the species based on the given properties, this process is commonly refered to as classification.
We included some exploratory analysis done with ggplot and plotly to demonstrate that even before running the functions on the data set, you can get a pretty good picture of the relationship between the predictors if you see how they interact visually!
We won't go into too much detail here since we draw a better picture on the project page, but we create the appropriate training and test set, where we also create a class vector that has the corresponding species from the test set. Which we will then use to measure how well our model did using the Test error rate.
The Test error rate is the most useful measurement in understanding how well our model did. In our case we have 150 observations, where we divided it up 3/4 are in our training set (so 112 observations) and 1/4 is in our test set (so 38 observations). And how we measure our effectiveness is by dividing the number of incorrectly predicted flowers by 38 and thus we have our test error rate. Again more details are within the project, but we wanted to give a synopsis of our methodology.