


The NOREVA package not only enables the pre-processing and assessment of multi-class/time-series metabolomic data but also realize a high-throughput discovery of the well-performing pre-processing workflows. Particularly, five well-established criteria, each with a distinct underlying theory, are integrated to ensure a much more comprehensive evaluation than any single criterion. This study provides guidelines for researchers who will engage in biomarker discovery or other differential profiling “omics” studies with respect selecting the most appropriate preprocessing method for a given dataset.For function descriptions and analysis of sample datasets you can also use “??NOREVA” command in R. NOREVA version 2.1.1 realizes (1) the parallel computing together with memory management and (2) the optimization of I/O efficiency.
You can cite the NOREVA publication as follows:
Optimization of metabolomic data processing using NOREVA.
J. B. Fu, Y. Zhang, Y. X. Wang, H. N. Zhang, J. Liu, J. Tang, Q. X. Yang, H. C. Sun, W. Q. Qiu, Y. H. Ma, Z. R. Li, M. Y. Zheng, F. Zhu*.
Nature Protocols. 17(1): 129-151 (2022). doi: 10.1038/s41596-021-00636-9; PubMed ID: 34952956.
Method 1. Download the source package of NOREVA.2.1.1.tar.gz and install it
install.packages("NOREVA.2.1.1.tar.gz", repos = NULL, type = "source", INSTALL_opts = "--no-multiarch")

##NOREVA package depends on several packages, which can be installed using the below commands:
if (!requireNamespace("BiocManager", quietly = TRUE))
install.packages("BiocManager")
BiocManager::install("Biobase")
BiocManager::install("pcaMethods")
BiocManager::install("multtest")
BiocManager::install("limma")
BiocManager::install("impute")
BiocManager::install("statTarget")
BiocManager::install("ProteoMM")
BiocManager::install("timecourse")
BiocManager::install("ropls")
BiocManager::install("vsn")
BiocManager::install("affy")
devtools::install_github("metabolomicstats/NormalizeMets")
devtools::install_github("fawda123/ggord")
install.packages(c('rJava', 'DiffCorr', 'MetNorm', 'ggsci', 'multiROC', 'dummies', 'ggfortify', 'ggpubr', 'sampling', 'VennDiagram', 'RcmdrMisc', 'reshape2', 'futile.logger', 'data.table', 'tidyverse', 'foreach', 'iterators', 'parallel', 'doSNOW'))

Method 2. Or the development version from GitHub:
install.packages("devtools")
devtools::install_github("idrblab/NOREVA")

##NOREVA package depends on several packages, which can be installed using the below commands:
if (!requireNamespace("BiocManager", quietly = TRUE))
install.packages("BiocManager")
BiocManager::install("Biobase")
BiocManager::install("pcaMethods")
BiocManager::install("multtest")
BiocManager::install("limma")
BiocManager::install("impute")
BiocManager::install("statTarget")
BiocManager::install("ProteoMM")
BiocManager::install("timecourse")
BiocManager::install("ropls")
BiocManager::install("vsn")
BiocManager::install("affy")
devtools::install_github("metabolomicstats/NormalizeMets")
devtools::install_github("fawda123/ggord")library(NOREVA)
1. This function enables the preparation and input of peak table which facilitate the subsequent application of other NOREVA functions.
PrepareInuputFiles(dataformat, rawdata, label)
dataformat
This variable allows the user to specify the FORMAT of their input peak table.
“1” denotes the standardized format of peak table accepted by NOREVA;
“2” denotes the customized format of peak table generated by 12 available software tools.
rawdata
This variable allows the user to indicate the NAME of their input peak table file.
label
This variable allows the user to indicate the NAME of their input label file for time-course/multi-class.
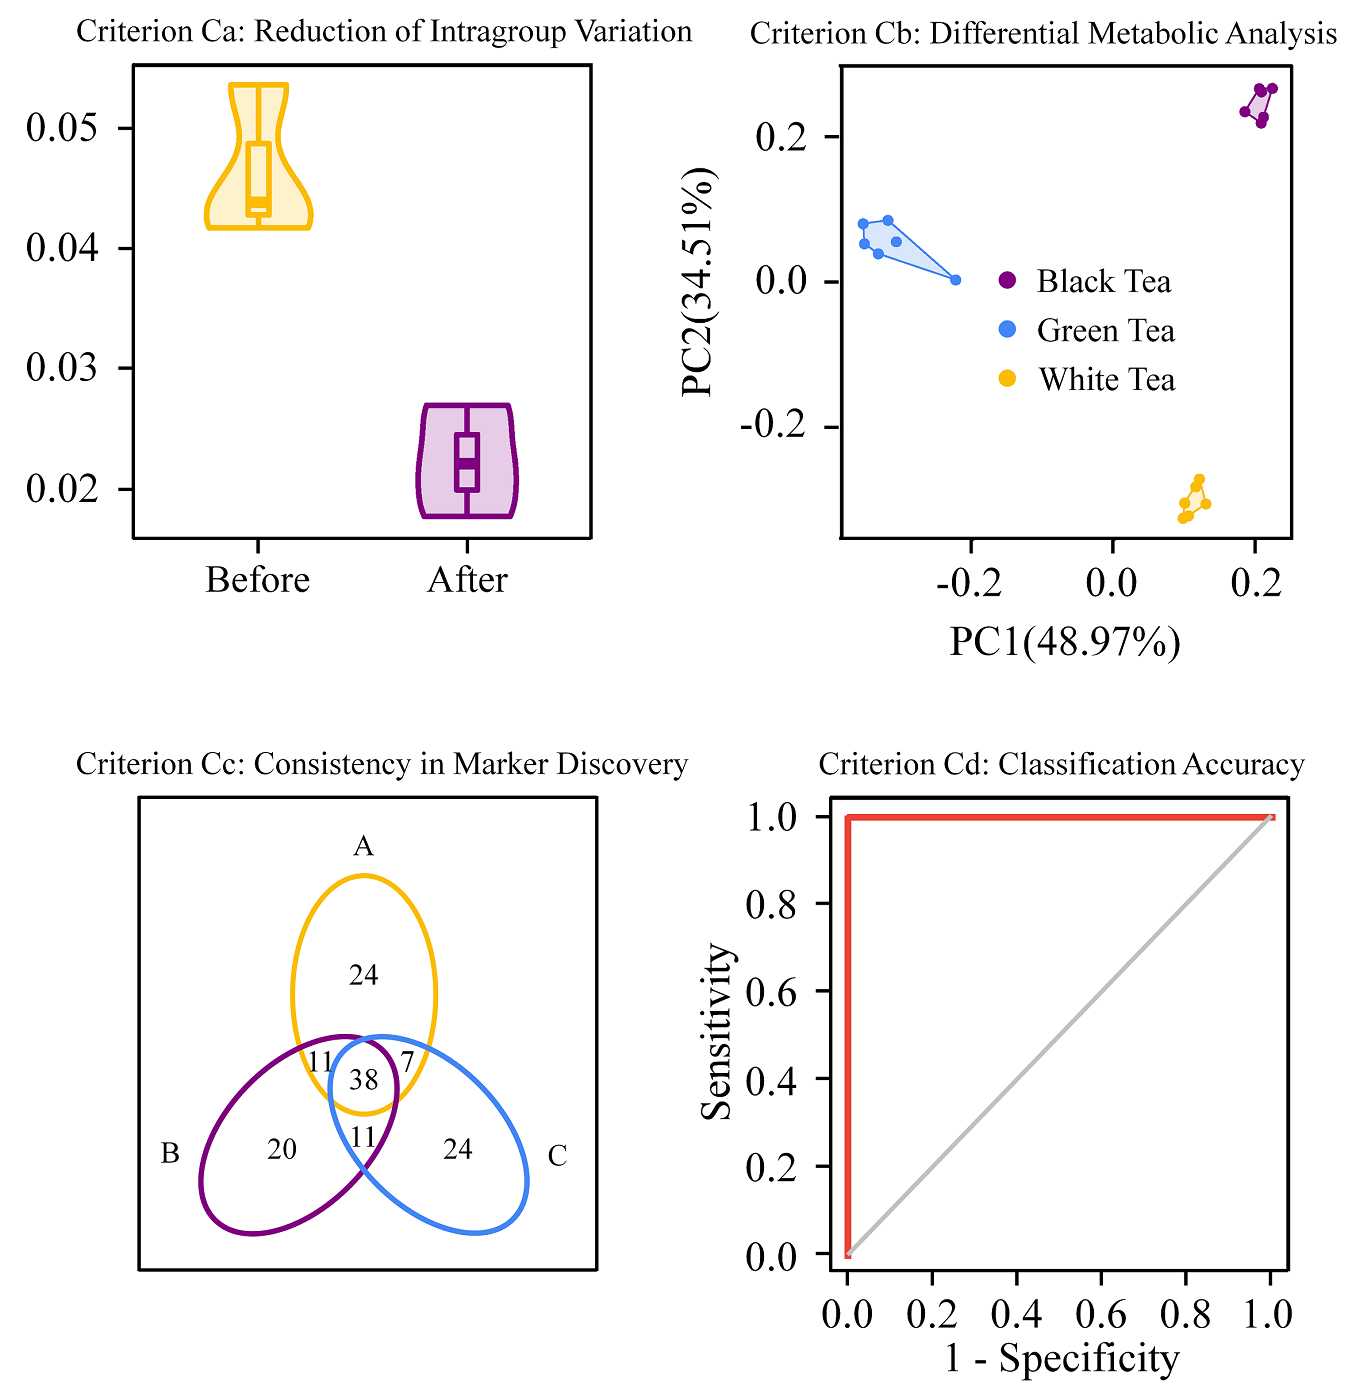
2. This function enables the performance assessment of metabolomic data processing for multi-class dataset (with quality control sample but without internal standard) using four criteria, and can scan thousands of processing workflows and rank them based on their performances.
normulticlassqcall(fileName, SAalpha="Y", SAbeta="Y", SAgamma="Y")
fileName
This variable allows the user to indicate the NAME of result obtained from PrepareInuputFiles function.
SAalpha
This variable allows the user to specify the study assumption of their input peak table.
“Y” denotes the peak table satisfies the study assumption.
“N” denotes the peak table satisfies the study assumption.
Study assumption alpha represents that all metabolites are assumed to be equally important.
SAbeta
This variable allows the user to specify the study assumption of their input peak table.
“Y” denotes the peak table satisfies the study assumption.
“N” denotes the peak table satisfies the study assumption.
Study assumption beta represents that the level of metabolite abundance is constant among all samples.
SAgamma
This variable allows the user to specify the study assumption of their input peak table.
“Y” denotes the peak table satisfies the study assumption.
“N” denotes the peak table satisfies the study assumption.
Study assumption gamma represents that the intensities of the majority of the metabolites are not changed under the studied conditions.
3. This function enables the performance assessment of metabolomic data processing for multi-class dataset (without quality control sample and without internal standard) using four independent criteria, and can comprehensively scan thousands of processing workflows and rank all these workflows based on their performances (assessed from four different perspectives).
normulticlassnoall(fileName, SAalpha="Y", SAbeta="Y", SAgamma="Y")
fileName
This variable allows the user to indicate the NAME of result obtained from PrepareInuputFiles function.
SAalpha
This variable allows the user to specify the study assumption of their input peak table.
“Y” denotes the peak table satisfies the study assumption.
“N” denotes the peak table satisfies the study assumption.
Study assumption alpha represents that all metabolites are assumed to be equally important.
SAbeta
This variable allows the user to specify the study assumption of their input peak table.
“Y” denotes the peak table satisfies the study assumption.
“N” denotes the peak table satisfies the study assumption.
Study assumption beta represents that the level of metabolite abundance is constant among all samples.
SAgamma
This variable allows the user to specify the study assumption of their input peak table.
“Y” denotes the peak table satisfies the study assumption.
“N” denotes the peak table satisfies the study assumption.
Study assumption gamma represents that the intensities of the majority of the metabolites are not changed under the studied conditions.
4. This function enables the performance assessment of metabolomic data processing for multi-class dataset (with internal standards but without quality control sample) using four criteria, and can scan thousands of processing workflows and rank them based on their performances.
normulticlassisall(fileName, IS)
fileName
This variable allows the user to indicate the NAME of result obtained from PrepareInuputFiles function.
IS
This variable allows the user to indicate the column of IS.
If there is only one IS, the column number of this IS should be listed.
If there are multiple ISs, the column number of all ISs should be listed and separated by comma (,).
For example, the replacement of IS to 2,6,9,n indicates that the metabolites in the 2st, 6th, 9th, and nth columns of in your peak table should be considered as the ISs metabolites.
5. This function enables the performance assessment of metabolomic data processing for the time-course dataset (with quality control sample but without internal standard) using four independent criteria, and can comprehensively scan thousands of processing workflows and rank all these workflows based on their performances (assessed from four different perspectives).
nortimecourseqcall(fileName, SAalpha="Y", SAbeta="Y", SAgamma="Y")
fileName
This variable allows the user to indicate the NAME of result obtained from PrepareInuputFiles function.
SAalpha
This variable allows the user to specify the study assumption of their input peak table.
“Y” denotes the peak table satisfies the study assumption.
“N” denotes the peak table satisfies the study assumption.
Study assumption alpha represents that all metabolites are assumed to be equally important.
SAbeta
This variable allows the user to specify the study assumption of their input peak table.
“Y” denotes the peak table satisfies the study assumption.
“N” denotes the peak table satisfies the study assumption.
Study assumption beta represents that the level of metabolite abundance is constant among all samples.
SAgamma
This variable allows the user to specify the study assumption of their input peak table.
“Y” denotes the peak table satisfies the study assumption.
“N” denotes the peak table satisfies the study assumption.
Study assumption gamma represents that the intensities of the majority of the metabolites are not changed under the studied conditions.
6. This function enables the performance assessment of metabolomic data processing for time-course dataset (without quality control sample and without internal standard) using four independent criteria, and can comprehensively scan thousands of processing workflows and rank all these workflows based on their performances (assessed from four different perspectives).
nortimecoursenoall(fileName, SAalpha="Y", SAbeta="Y", SAgamma="Y")
fileName
This variable allows the user to indicate the NAME of result obtained from PrepareInuputFiles function.
SAalpha
This variable allows the user to specify the study assumption of their input peak table.
“Y” denotes the peak table satisfies the study assumption.
“N” denotes the peak table satisfies the study assumption.
Study assumption alpha represents that all metabolites are assumed to be equally important.
SAbeta
This variable allows the user to specify the study assumption of their input peak table.
“Y” denotes the peak table satisfies the study assumption.
“N” denotes the peak table satisfies the study assumption.
Study assumption beta represents that the level of metabolite abundance is constant among all samples.
SAgamma
This variable allows the user to specify the study assumption of their input peak table.
“Y” denotes the peak table satisfies the study assumption.
“N” denotes the peak table satisfies the study assumption.
Study assumption gamma represents that the intensities of the majority of the metabolites are not changed under the studied conditions.
7. This function enables the performance assessment of metabolomic data processing for time-course dataset (with internal standards but without quality control sample) using four independent criteria, and can comprehensively scan thousands of processing workflows and rank all these workflows based on their performances (assessed from four different perspectives).
nortimecourseisall(fileName, IS)
fileName
This variable allows the user to indicate the NAME of result obtained from PrepareInuputFiles function.
IS
This variable allows the user to indicate the column of IS.
If there is only one IS, the column number of this IS should be listed.
If there are multiple ISs, the column number of all ISs should be listed and separated by comma (,).
For example, the replacement of IS to 2,6,9,n indicates that the metabolites in the 2st, 6th, 9th, and nth columns of in your peak table should be considered as the ISs metabolites.
8. This function enables the performance assessment of metabolomic data processing for multi-class dataset (with quality control sample but without internal standard) using five independent criteria, and can comprehensively scan thousands of processing workflows and rank all these workflows based on their performances.
normulticlassqcall(fileName, GS, SAalpha="Y", SAbeta="Y", SAgamma="Y")
fileName
This variable allows the user to indicate the NAME of result obtained from PrepareInuputFiles function.
GS
The corresponding data of golden standards for performance evaluation using Criterion e. For the detailed information of the correct file format, please use “??NOREVA” and download sample data in the corresponding section “Welcome to Download the Sample Data for Testing and for File Format Correcting”.
SAalpha
This variable allows the user to specify the study assumption of their input peak table.
“Y” denotes the peak table satisfies the study assumption.
“N” denotes the peak table satisfies the study assumption.
Study assumption alpha represents that all metabolites are assumed to be equally important.
SAbeta
This variable allows the user to specify the study assumption of their input peak table.
“Y” denotes the peak table satisfies the study assumption.
“N” denotes the peak table satisfies the study assumption.
Study assumption beta represents that the level of metabolite abundance is constant among all samples.
SAgamma
This variable allows the user to specify the study assumption of their input peak table.
“Y” denotes the peak table satisfies the study assumption.
“N” denotes the peak table satisfies the study assumption.
Study assumption gamma represents that the intensities of the majority of the metabolites are not changed under the studied conditions.
9. This function enables the performance assessment of metabolomic data processing for multi-class dataset (without quality control sample and without internal standard) using five criteria, and can scan thousands of workflows and rank them based on their performances.
normulticlassnoall(fileName, GS, SAalpha="Y", SAbeta="Y", SAgamma="Y")
fileName
This variable allows the user to indicate the NAME of result obtained from PrepareInuputFiles function.
GS
The corresponding data of golden standards for performance evaluation using Criterion e. For the detailed information of the correct file format, please use “??NOREVA” and download sample data in the corresponding section “Welcome to Download the Sample Data for Testing and for File Format Correcting”.
SAalpha
This variable allows the user to specify the study assumption of their input peak table.
“Y” denotes the peak table satisfies the study assumption.
“N” denotes the peak table satisfies the study assumption.
Study assumption alpha represents that all metabolites are assumed to be equally important.
SAbeta
This variable allows the user to specify the study assumption of their input peak table.
“Y” denotes the peak table satisfies the study assumption.
“N” denotes the peak table satisfies the study assumption.
Study assumption beta represents that the level of metabolite abundance is constant among all samples.
SAgamma
This variable allows the user to specify the study assumption of their input peak table.
“Y” denotes the peak table satisfies the study assumption.
“N” denotes the peak table satisfies the study assumption.
Study assumption gamma represents that the intensities of the majority of the metabolites are not changed under the studied conditions.
10. This function enables the performance assessment of metabolomic data processing for multi-class dataset (with internal standards but without quality control sample) using five criteria, and can scan thousands of processing workflows and rank them based on their performances.
normulticlassisall(fileName, IS, GS)
fileName
This variable allows the user to indicate the NAME of result obtained from PrepareInuputFiles function.
GS
The corresponding data of golden standards for performance evaluation using Criterion e. For the detailed information of the correct file format, please use “??NOREVA” and download sample data in the corresponding section “Welcome to Download the Sample Data for Testing and for File Format Correcting”.
IS
This variable allows the user to indicate the column of IS.
If there is only one IS, the column number of this IS should be listed.
If there are multiple ISs, the column number of all ISs should be listed and separated by comma (,).
For example, the replacement of IS to 2,6,9,n indicates that the metabolites in the 2st, 6th, 9th, and nth columns of in your peak table should be considered as the ISs metabolites.
11. This function enables the performance assessment of metabolomic data processing for the time-course dataset (with quality control sample but without internal standard) using five criteria, and can scan thousands of workflows and rank them based on their performances.
nortimecourseqcallgs(fileName, GS, SAalpha="Y", SAbeta="Y", SAgamma="Y")
fileName
This variable allows the user to indicate the NAME of result obtained from PrepareInuputFiles function.
GS
The corresponding data of golden standards for performance evaluation using Criterion e. For the detailed information of the correct file format, please use “??NOREVA” and download sample data in the corresponding section “Welcome to Download the Sample Data for Testing and for File Format Correcting”.
SAalpha
This variable allows the user to specify the study assumption of their input peak table.
“Y” denotes the peak table satisfies the study assumption.
“N” denotes the peak table satisfies the study assumption.
Study assumption alpha represents that all metabolites are assumed to be equally important.
SAbeta
This variable allows the user to specify the study assumption of their input peak table.
“Y” denotes the peak table satisfies the study assumption.
“N” denotes the peak table satisfies the study assumption.
Study assumption beta represents that the level of metabolite abundance is constant among all samples.
SAgamma
This variable allows the user to specify the study assumption of their input peak table.
“Y” denotes the peak table satisfies the study assumption.
“N” denotes the peak table satisfies the study assumption.
Study assumption gamma represents that the intensities of the majority of the metabolites are not changed under the studied conditions.
12. This function enables the performance assessment of metabolomic data processing for time-course dataset (without quality control sample and without internal standard) using five criteria, and can scan thousands of workflows and rank them based on their performances.
nortimecoursenoallgs(fileName, GS, SAalpha="Y", SAbeta="Y", SAgamma="Y")
fileName
This variable allows the user to indicate the NAME of result obtained from PrepareInuputFiles function.
GS
The corresponding data of golden standards for performance evaluation using Criterion e. For the detailed information of the correct file format, please use “??NOREVA” and download sample data in the corresponding section “Welcome to Download the Sample Data for Testing and for File Format Correcting”.
SAalpha
This variable allows the user to specify the study assumption of their input peak table.
“Y” denotes the peak table satisfies the study assumption.
“N” denotes the peak table satisfies the study assumption.
Study assumption alpha represents that all metabolites are assumed to be equally important.
SAbeta
This variable allows the user to specify the study assumption of their input peak table.
“Y” denotes the peak table satisfies the study assumption.
“N” denotes the peak table satisfies the study assumption.
Study assumption beta represents that the level of metabolite abundance is constant among all samples.
SAgamma
This variable allows the user to specify the study assumption of their input peak table.
“Y” denotes the peak table satisfies the study assumption.
“N” denotes the peak table satisfies the study assumption.
Study assumption gamma represents that the intensities of the majority of the metabolites are not changed under the studied conditions.
13. This function enables the performance assessment of metabolomic data processing for time-course dataset (with internal standards but without quality control sample) using five criteria, and can scan thousands of processing workflows and rank them based on their performances.
nortimecourseisallgs(fileName, IS, GS)
fileName
This variable allows the user to indicate the NAME of result obtained from PrepareInuputFiles function.
IS
This variable allows the user to indicate the column of IS.
If there is only one IS, the column number of this IS should be listed.
If there are multiple ISs, the column number of all ISs should be listed and separated by comma (,).
For example, the replacement of IS to 2,6,9,n indicates that the metabolites in the 2st, 6th, 9th, and nth columns of in your peak table should be considered as the ISs metabolites.
GS
The corresponding data of golden standards for performance evaluation using Criterion e. For the detailed information of the correct file format, please use “??NOREVA” and download sample data in the corresponding section “Welcome to Download the Sample Data for Testing and for File Format Correcting”.
14. This function enables the performance assessment of the processing workflows defined by the preference of NOREVA users based on time-course metabolomic study with dataset with QCSs.
nortimecourseqcpart(fileName, selectedMethods)
fileName
This variable allows the user to indicate the NAME of result obtained from PrepareInuputFiles function.
selectedMethods
This variable allows the user to indicate the NAME of the file containing processing workflows defined by the preference of NOREVA users. The file should be in the format of Comma-Separated Values (CSV). Exemplar files are provided by NOREVA and available for download at here.
15. This function enables the performance assessment of processing workflows defined by the preference of NOREVA users based on time-course metabolomics with ISs.
nortimecourseispart(fileName, IS, selectedMethods)
fileName
This function is used for processing the dataset with internal standards (ISs) of time-course metabolomic study. Sample data of this data type can be downloaded as the following section "Welcome to Download the Sample Data for Testing and for File Format Correcting".
IS
Input the Column of Internal Standards. For example, the replacement of IS to 2,6,9,n indicates that the metabolites in the 2st, 6th, 9th, and nth columns of in your input dataset Input-Dataset.csv should be considered as the ISs or quality control metabolites. If there is only one IS, the column number of this IS should be listed. If there are multiple ISs, the column number of all ISs should be listed and separated by comma (,).
selectedMethods
This variable allows the user to indicate the NAME of the file containing processing workflows defined by the preference of NOREVA users. The file should be in the format of Comma-Separated Values (CSV). Exemplar files are provided by NOREVA and available for download at here.
16. This function enables the performance assessment of processing workflows defined by users’ preference based on time-course metabolomics without QCSs and ISs.
nortimecoursenopart(fileName, selectedMethods)
fileName
This variable allows the user to indicate the NAME of result obtained from PrepareInuputFiles function.
selectedMethods
This variable allows the user to indicate the NAME of the file containing processing workflows defined by the preference of NOREVA users. The file should be in the format of Comma-Separated Values (CSV). Exemplar files are provided by NOREVA and available for download at here.
17. This function enables the performance assessment of processing workflows defined by users’ preference based on multi-class (N>1) metabolomic study with dataset with QCSs.
normulticlassqcpart(fileName, selectedMethods)
fileName
This variable allows the user to indicate the NAME of result obtained from PrepareInuputFiles function.
selectedMethods
This variable allows the user to indicate the NAME of the file containing processing workflows defined by the preference of NOREVA users. The file should be in the format of Comma-Separated Values (CSV). Exemplar files are provided by NOREVA and available for download at here.
18. This function enables the performance assessment of processing workflows defined by users’ preference based on multi-class (N>1) metabolomic study with dataset with ISs.
normulticlassispart(fileName, IS, selectedMethods)
fileName
This variable allows the user to indicate the NAME of result obtained from PrepareInuputFiles function.
IS
This variable allows the user to indicate the column of IS.
If there is only one IS, the column number of this IS should be listed.
If there are multiple ISs, the column number of all ISs should be listed and separated by comma (,).
For example, the replacement of IS to 2,6,9,n indicates that the metabolites in the 2st, 6th, 9th, and nth columns of in your peak table should be considered as the ISs metabolites.
selectedMethods
This variable allows the user to indicate the NAME of the file containing processing workflows defined by the preference of NOREVA users. The file should be in the format of Comma-Separated Values (CSV). Exemplar files are provided by NOREVA and available for download at here.
19. This function enables the performance assessment of the processing workflows defined by the preference of NOREVA users based on multi-class (N>1) metabolomic study with dataset without QCSs and ISs.
seleranks_non <- normulticlassnopart(fileName, selectedMethods)
fileName
This variable allows the user to indicate the NAME of result obtained from PrepareInuputFiles function.
selectedMethods
This variable allows the user to indicate the NAME of the file containing processing workflows defined by the preference of NOREVA users. The file should be in the format of Comma-Separated Values (CSV). Exemplar files are provided by NOREVA and available for download at here.
20. This function will output a processed peak table of time-course metabolomic study according to the choice of users must provide the processing workflow.
nortimecoursematrix(datatype, fileName, IS, impt=NULL, qcsn=NULL, trsf=NULL, nmal=NULL, nmal2=NULL, nmals=NULL)
datatype
This variable allows the user to specify the Type of their input peak table.
“1” denotes time-course metabolomic study without QCSs and ISs.
“2” denotes time-course metabolomic study with QCSs.
“3” denotes time-course metabolomic study with ISs.
fileName
This variable allows the user to indicate the NAME of result obtained from PrepareInuputFiles function.
IS
This variable allows the user to indicate the column of IS.
If there is only one IS, the column number of this IS should be listed.
If there are multiple ISs, the column number of all ISs should be listed and separated by comma (,).
For example, the replacement of IS to 2,6,9,n indicates that the metabolites in the 2st, 6th, 9th, and nth columns of in your peak table should be considered as the ISs metabolites.
impt
This variable allows the user to specify the Type of imputation method.
“1” denotes method of column mean imputation.
“2” denotes method of column median imputation.
“3” denotes method of half of the minimum positive value.
“4” denote method of K-nearest neighbor imputation
qcsn
Allows the users to specify the NAME of the quality control sample correction method (default = 1).
“1” denotes the method of NWE (Nadaraya-Watson estimator).
“2” denotes the method of LLR (local linear regression).
“3” denotes the method of LPF (local polynomial fits)
trsf
This variable allows the user to specify the Type of transformation method.
“1” denotes method of cube root transformation.
“2” denotes method of log transformation.
“3” denotes none transformation method.
nmal
This variable allows the user to specify the Type of normalization method.
“1” denotes none normalization method.
Metabolite-based Normalization:
"2" denotes method of probabilistic quotient normalization.
"3" denotes method of cyclic loess.
"4" denotes method of contrast.
"5" denotes method of quantile.
"6" denotes method of linear baseline.
"7" denotes method of Li-Wong.
"8" denotes method of cubic splines.
"16" denotes method of MS total useful signal.
"17" denotes method of total sum normalization.
"18" denotes method of median normalization.
"19" denotes method of mean normalization.
"20" denotes method of EigenMS.
Sample-based Normalization:
"9" denotes method of auto scaling.
"10" denotes method of range scaling.
"11" denotes method of pareto scaling.
"12" denotes method of vast scaling.
"13" denotes method of level scaling.
"15" denotes method of power scaling.
Sample & Metabolite-based Normalization:
"14" denotes method of variance stabilization normalization.
nmal2
This variable allows the user to specify the Type of normalization method. According to the normalization methods of combination strategy, if you choose sample-based normalization methods for argument “nmal”, “nmal2” should select metabolite-based normalization methods. Similarly, if you choose metabolite-based normalization methods for argument “nmal”, “nmal2” should select sample-based normalization methods. The VSN method you selected is a sample & metabolite-based normalization, which should be applied alone to remove the unwanted signal variations.
nmals
This variable allows the user to specify the Type of IS-based normalization method.
“1” denotes method of Single Internal Standard.
“2” denotes method of Normalization using Optimal Selection of Multiple ISs.
“3” denotes method of Cross-contribution Compensating Multi-ISs Normalization.
“4” denotes method of Remove Unwanted Variation-Random.
21. This function will output a processed peak table of multi-class metabolomic study according to the choice of users must provide the processing workflow.
normulticlassmatrix(datatype, fileName, IS, impt=NULL, qcsn=NULL, trsf=NULL, nmal=NULL, nmal2=NULL, nmals=NULL)
datatype
Input the number of data type.
If set 1, the dataset of multi-class (N>1) metabolomic study without QCSs and ISs.
If set 2, the dataset of multi-class (N>1) metabolomic study with QC samples (QCSs).
If set 3, the dataset of multi-class (N>1) metabolomic study with dataset with (ISs).
fileName
This variable allows the user to indicate the NAME of result obtained from PrepareInuputFiles function.
IS
This variable allows the user to indicate the column of IS.
If there is only one IS, the column number of this IS should be listed.
If there are multiple ISs, the column number of all ISs should be listed and separated by comma (,).
For example, the replacement of IS to 2,6,9,n indicates that the metabolites in the 2st, 6th, 9th, and nth columns of in your peak table should be considered as the ISs metabolites.
impt
This variable allows the user to specify the Type of imputation method.
“1” denotes method of column mean imputation.
“2” denotes method of column median imputation.
“3” denotes method of half of the minimum positive value.
“4” denote method of K-nearest neighbor imputation
qcsn
Allows the users to specify the NAME of the quality control sample correction method (default = 1).
“1” denotes the method of NWE (Nadaraya-Watson estimator).
“2” denotes the method of LLR (local linear regression).
“3” denotes the method of LPF (local polynomial fits)
trsf
This variable allows the user to specify the Type of transformation method.
“1” denotes method of cube root transformation.
“2” denotes method of log transformation.
“3” denotes none transformation method.
nmal
This variable allows the user to specify the Type of normalization method.
“1” denotes none normalization method.
Metabolite-based Normalization:
"2" denotes method of probabilistic quotient normalization.
"3" denotes method of cyclic loess.
"4" denotes method of contrast.
"5" denotes method of quantile.
"6" denotes method of linear baseline.
"7" denotes method of Li-Wong.
"8" denotes method of cubic splines.
"16" denotes method of MS total useful signal.
"17" denotes method of total sum normalization.
"18" denotes method of median normalization.
"19" denotes method of mean normalization.
"20" denotes method of EigenMS.
Sample-based Normalization:
"9" denotes method of auto scaling.
"10" denotes method of range scaling.
"11" denotes method of pareto scaling.
"12" denotes method of vast scaling.
"13" denotes method of level scaling.
"15" denotes method of power scaling.
Sample & Metabolite-based Normalization:
"14" denotes method of variance stabilization normalization.
nmal2
This variable allows the user to specify the Type of normalization method. According to the normalization methods of combination strategy, if you choose sample-based normalization methods for argument “nmal”, “nmal2” should select metabolite-based normalization methods. Similarly, if you choose metabolite-based normalization methods for argument “nmal”, “nmal2” should select sample-based normalization methods. The VSN method you selected is a sample & metabolite-based normalization, which should be applied alone to remove the unwanted signal variations.
nmals
This variable allows the user to specify the Type of IS-based normalization method.
“1” denotes method of Single Internal Standard.
“2” denotes method of Normalization using Optimal Selection of Multiple ISs.
“3” denotes method of Cross-contribution Compensating Multi-ISs Normalization.
“4” denotes method of Remove Unwanted Variation-Random.
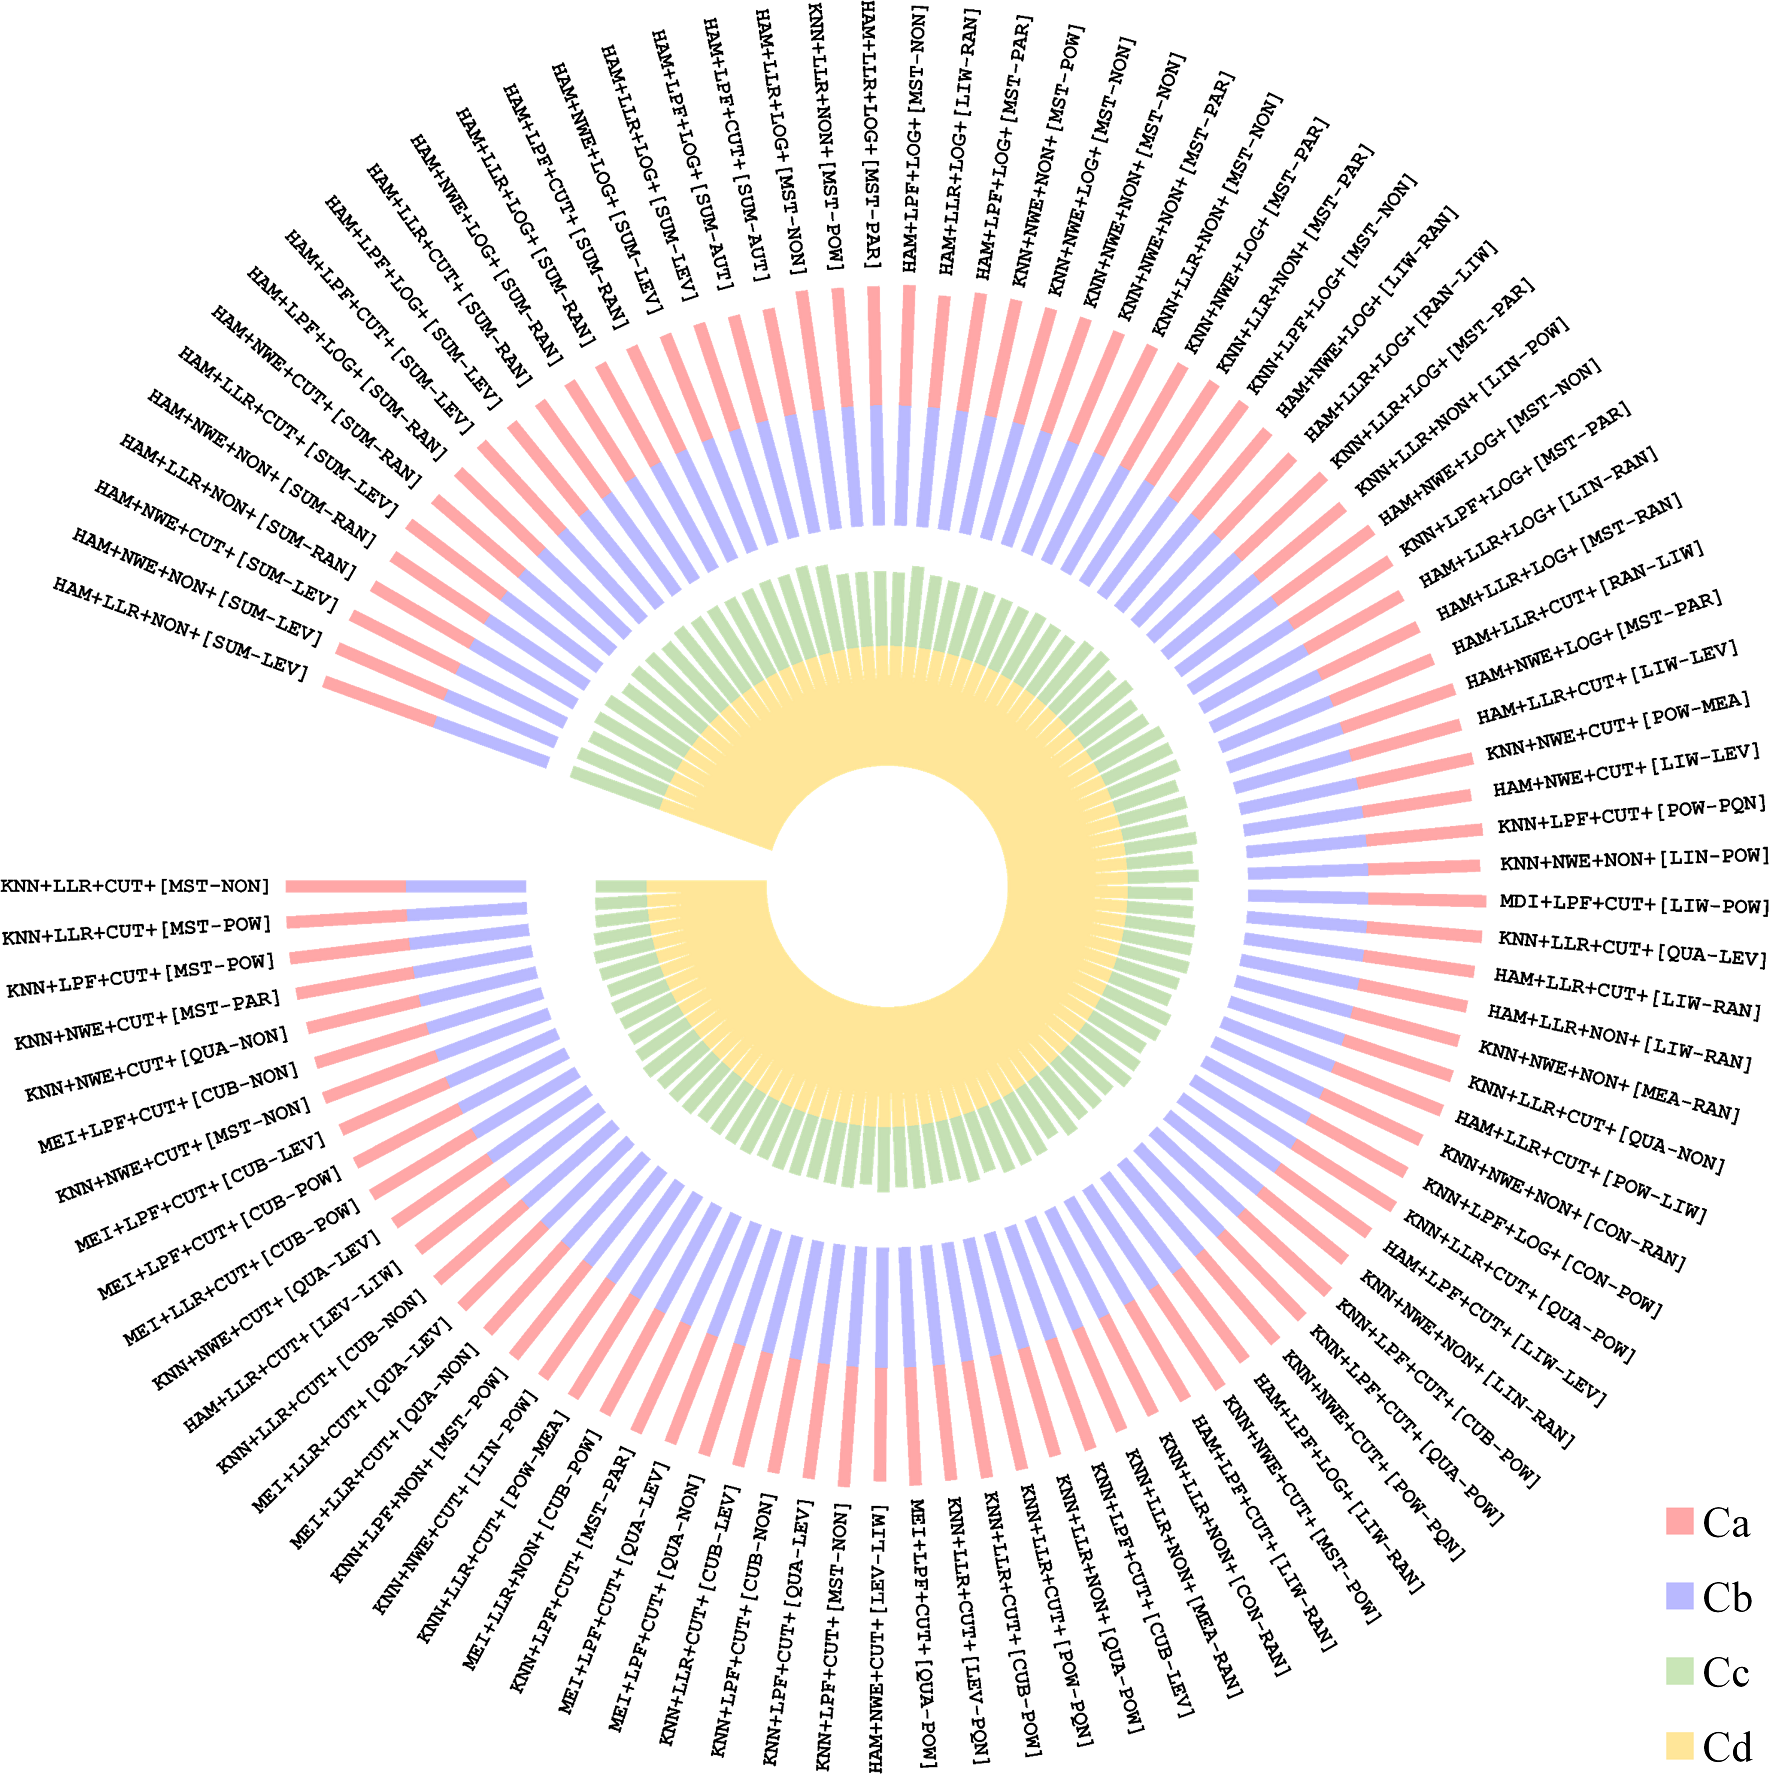
22. Plot circular barplot of overall ranking results. A circular barplot illustrating the performance level and the overall ranking of all calculatable processing workflows based on the multiple criteria or a single criterion that are selected by user.
norvisualization(data, outputfile="NOREVA-Ranking-Top.%d.workflows.%s",cutoff="100", outputtype="pdf", maxValue="40", colorSet = c("#EA4335", "#4285F4", "#FBBC05", "#800080"), totalAngle = "340", bgColor = "#FFFFFF", fontColor="#000000")
data
This variable allows the user to specify the NAME of the file (.csv) containing the names of processing workflows, their ranking value and representative measurement values under differential criteria, which is obtained from the functions such as the “normulticlassnoall”, “normulticlassqcall”, “nortimecourseqcall”, or “nortimecoursenoall” et al.
outputfile
This variable allows the user to specify the NAME of the output file. A format string containing the cutoff value and data type to generate formatted file name.
cutoff
This variable allows the user to specify the cutoff value. Integer for the number of strategies ranking at the top of the list, which is used to filter the results. Integer, which means to filter the results, the default is 100.
outputtype
String, indicating the output type, support pdf, eps, default is pdf.
maxValue
Double-precision floating-point number, representing the characteristic value represented by the maximum length of the rectangle, the default is 40.
colorSet
Hexadecimal color string group, representing the four-layer color setting of the graphics from the inside to the outside, the default is red (#EA4335), blue (#4285F4), yellow (#FBBC05), purple (#800080).
totalAngle
Double-precision floating-point number, representing the total angle of rotation of the drawing, in degrees, the default value is 340.
bgColor
Hexadecimal color string, representing the background color of the graphic drawing, the default is white (#FFFFFF).
fontColor
Hexadecimal color string, representing the font color, the default is black (#000000).
# Time-course Metabolomic Study
Dataset with quality control samples (QCSs) could be downloaded and the corresponding data of golden standards for performance evaluation using Criterion e could be downloaded.
Dataset with internal standards (ISs) could be downloaded and the corresponding data of golden standards for performance evaluation using Criterion e could be downloaded.
Dataset without QCSs and ISs could be downloaded and the corresponding data of golden standards for performance evaluation using Criterion e could be downloaded.
# Multi-class Metabolomic Study
Dataset with quality control samples (QCSs) could be downloaded and the corresponding data of golden standards for performance evaluation using Criterion e could be downloaded.
Dataset with internal standards (ISs) could be downloaded and the corresponding data of golden standards for performance evaluation using Criterion e could be downloaded.
Dataset without QCSs and ISs could be downloaded and the corresponding data of golden standards for performance evaluation using Criterion e could be downloaded.
Sequential step for the performance assessment of time-course metabolomic study with dataset with QCSs. For other types of study, replace the function related to the types.
Step 1: time_qcs_data <- PrepareInuputFiles(dataformat = 1, rawdata = "Timecourse-XXX.csv")
Step 2: nortimecourseqcall(fileName = time_qcs_data, SAalpha="Y", SAbeta="Y", SAgamma="Y")
Step 3: norvisualization(data = "OUTPUT-NOREVA-Overall.Ranking.Data.csv", cutoff = "100")
Sequential step for the performance assessment of time-course metabolomic study with dataset with QCSs. For other types of study, replace the function related to the types.
Step 1: multi_qcs_data <- PrepareInuputFiles(dataformat = 1, rawdata = "Multiclass-XXX.csv")
Step 2: normulticlassqcall(fileName = multi_qcs_data, SAalpha="Y", SAbeta="Y", SAgamma="Y")
Step 3: norvisualization(data = "OUTPUT-NOREVA-Overall.Ranking.Data.csv", cutoff = "100")
multi_qcs_data <- PrepareInuputFiles(dataformat = 1, rawdata = "Multiclass_with_QCS.csv")
Note: the file should be in the format of Comma-Separated Values (CSV), which provides the intensity data of metablites. Different functions require different data types. Please refer to the corresponding section "Welcome to Download the Sample Data for Testing and for File Format Correcting" above.
Multi-class (N>1) Metabolomic Study with dataset with Quality Control Samples (QCSs)
normulticlassqcall(fileName = multi_qcs_data, SAalpha="Y", SAbeta="Y", SAgamma="Y")
allrankings <- read.csv(file = "./sampledata/OUTPUT-NOREVA-Overall.Ranking.Data.csv",header = T)
head(allrankings)
norvisualization(data = "OUTPUT-NOREVA-Overall.Ranking.Data.csv", cutoff = "100")
Comprehensive assessment among all processing workflows (the top-100 were shown).
Process the datasets of multi-class (N>1) metabolomic study
nordata <- normulticlassmatrix(datatype = 2, fileName = multi_qcs_data, impt=3, qcsn =1, trsf=1, nmal=17, nmal2=13)
Note: please select the appropriate number code represents imputation, qc sample correction, transformation, normalization methods (See above details).
Step 5: Users can also use NOREVA for accessing the part of processing workflows which you preferred
Multi-class (N>1) Metabolomic Study with dataset with Quality Control Samples (QCSs)
normulticlassqcpart(fileName = multi_qcs_data, selectedMethods = "selectedMethods.csv")
Note: please select the appropriate number code represents imputation, qc sample correction, transformation, normalization methods (See above details).
Should you have any questions, please contact Jianbo Fu at fujianbo@zju.edu.cn