Adding in a VectorSignal #2876
Adding in a VectorSignal #2876
Conversation
Codecov Report
@@                  Coverage Diff                   @@
##           RELEASE_next_minor    #2876      +/-   ##
======================================================
+ Coverage               80.80%   80.92%   +0.12%
======================================================
  Files                     209      210       +1
  Lines                   32706    32950     +244
  Branches                 7329     7405      +76
======================================================
+ Hits                    26428    26665     +237
- Misses                   4512     4515       +3
- Partials                 1766     1770       +4
Help us with your feedback. Take ten seconds to tell us how you rate us. Have a feature suggestion? Share it here. |
|
Thanks for pinging me, @CSSFrancis. I'm interested in this class, although I don't have any use for it myself at the moment.
Instead of diffraction spots we have band positions and zone axes in EBSD patterns. In kikuchipy's geometrical simulations, which are used to project band centers and zone axes as HyperSpy markers to plot on top of experimental patterns for visual inspection, we allow for varying numbers of bands (and zone axes) per navigation position. Band positions for the whole 4D data set are stored in an array of fixed shape (n rows, n columns, n unique bands, detector row coordinate, detector column coordinate), and coordinates of bands not present in a pattern are set to NaN. It looks like the VectorSignal class could replace this array. I don't know how clustering could be used since we already have orientations to cluster if patterns are indexed. Perhaps band clustering (detected via the Hough transform) could aid in Hough indexing in some way. |
|
This is really nice! As I mentioned in pyxem/pyxem#789 (comment), better handling of vector data would be a big improvement for a range of applications. With regards to this pull request, I think keeping it within a reasonable size is a good idea. With this, I mean adding the basics, where the more advanced features can be added in future pull requests. Code review of very large pull requests is quite difficult. For functionality, a basic set could be:
I agree with any vector dimensionality should be possible, but I think the 2D-kind will be the most applicable. Both for pyxem diffraction spots, and potentially atomap atomic column positions. So I'm not sure exactly how best to structure this, maybe similarly as the current |
@hakonanes I would hope that this is used more as an easy way for positions in a pixel-wise image to be converted to real units. I'm still working on the saving aspect as well, but that would be another potential application where you could easily save and reload analysis. The idea there being the ability to publish you results in a fashion that could be interactive. The clustering might be interesting if you wanted to cluster in in both reciprocal space and real space. It also just gives many different options to try with little overhead which I think is important.
That is a good reminder before I expand this too much. I'll try to keep it pretty basic.
I'm not sure about how to deal with the plotting. I have implemented a to_marker function that works pretty well. The only problem is that you have to plot it on a signal. I could probably just make a plot function though as well, it might just take me a while to figure out how hyperspy plots signals.
I agree with you to a certain extent, I should probably create a As to why I think that the 4-D vector is important: At a higher level I think that in a 4 dimensional datasets we are limiting ourselves by operating on each (x,y) position separately. There are lots of ML methods which cluster, filter and work very well on high dimensional vectors. I think that our community has been rather slow to implement these because we are stuck working on each diffraction pattern separately. We have lots of redundancies in our data that aren't exploited. That is initially what motivated this work in the first part. As data gets larger and larger, identifying a reduced set of diffraction features, peak positions etc, that can be analyzed becomes very powerful. |
|
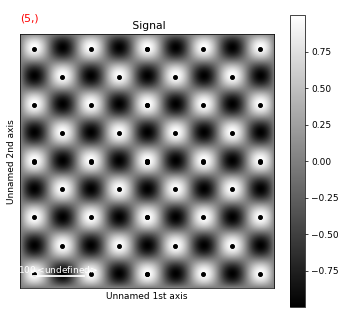
I was working on this tonight and was wondering how people feel about slicing vectors? I got it working so you can use .isig to select only vectors in a certain area. I think this would be an easy way to only look at some of the signal vectors. This code needs to be streamlined a little but this is what I have now. import numpy as np
import hyperspy.api as hs
data = np.array([np.sin(np.linspace(0,i*np.pi,500)) for i in range(4,10)])
data = np.array([np.multiply(d[:,np.newaxis], d[np.newaxis,:])for d in data])
s =hs.signals.Signal2D(data)
peaks = s.find_peaks(method="local_max",interactive=False)
peaks = BaseVectorSignal(peaks)
peaks.vector=True
print(peaks) # <BaseVectorSignal, title: , dimensions: (6|Vect , Vect)>
markers = peaks.to_markers()
s.plot()
s.add_marker(markers)
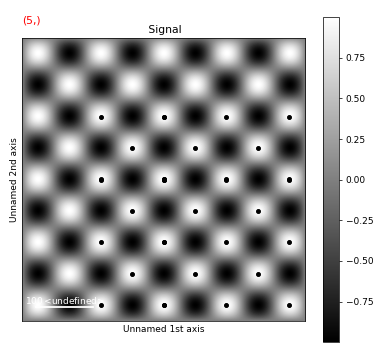
And then after slicing the vectors: markers = peaks.isig[100:,100:].to_markers()
s.plot()
s.add_marker(markers)
This slicing should still work with real units etc. I am still working on a better way to just plot the vectors without a signal to plot them on. I have thought about just kind of making a hacky signal with a signal dim of 1 and then plotting the makers on that. That might be easier than creating a whole other plotting tools for dealing with vectors. |
8f0ea60
to
521acfb
Compare
The
I think that sounds really good and useful. |
So my quick fix to plotting a 4D Diffraction vector would be to make a signal that is [Navshape|1,1] and then just set the scale, offset, etc so that when you plot the markers on the signal it would display them like it would on a normal signal. There is also the option of messing with the plotting code, but like you said it is a little more difficult. I would have to look at that a little more to get it to work.
The slicing works pretty well. I might consider adding in support for ROI's and the such. The idea being to support most of the things that are currently in pyxem. This would be excluding edges |
|
With regards to the |
@magnunor That would be very helpful. I think that this PR is pretty solidly in the Next version release after 1.7 just considering that should go out sooner rather than later and this PR still isn't where I would like it to be. Everything seems to work fairly well at the moment but it will take some additional thought as to how we should handle the My goal was to kind of work on this in parallel to some changes in |
|
Yeah, I agree. Getting the basics right in the initial implementation is going to save us a lot of hassle later, since a lot of functionality is going to be built on top of this. For example: this functionality would be really nice for a reworking of Atomap. But there, the vectors signal would not need a navigation dimension. However, for pyxem, with scanning diffraction, having navigation dimensions for all the vector signals would probably be the best. |
|
@ericpre is there a reason that the ragged property for a signal needs to be set rather than making the ragged property more of a strict type checking. If the dtype for the array is and object then the array has to be ragged. |
See #2944 (comment). |
ff66e1f
to
2dfcf89
Compare
|
If anyone has time to review this that would be much appreciated. I tried to change as little as possible to how hyperspy functions with this and the overall code changes should be rather small. This is probably a fairly stable base that we can continue to work with down stream at pyxem. I'm hoping that will help to find any bugs before the 1.8 release. I know that @magnunor you had some interest in the past so any input you have would be appricated. There are a lot of places in |
|
Failing tests are related to equality in the traits package. |
NewFeature: Added in index in vector axis property to `VectorDataAxis` class
b15a9c5
to
94fe3ab
Compare
There was a problem hiding this comment.
Thanks @CSSFrancis for making good progress on this!
VectorDataAxis is a misleading name because the only specificity of this axis type is that the size is variable for different navigation position, as in the case of ragged signal. It is used for vector signal but intrinsically it is not a "vector". Actually, would it be more accurate to rename VectorSignal to VariableSizeSignal, as it is more generic?
I suspect that it should be possible to structure the relationship between different type of axis more consistently. Here is a suggestion:
class BaseDataAxis:
   # size is not defined

class VariableSizeUniformDataAxis(BaseDataAxis):
   # construct from offset and scale
   # size is not defined

class DataAxis(BaseDataAxis):
   # construct from an array
   # size is defined

class FunctionalDataAxis(BaseDataAxis):
   # construct from an expression
   # size is defined

class UniformDataAxis(BaseDataAxis):
   # construct from an expression
   # size is defined
Then we could make ragged and vector signal more consistent and defined in the AxesManager:
- a vector signal has one or several
VariableSizeUniformDataAxissignal axis, allsignal_axesmust have the same size at each navigation position - a ragged signal has a single
VariableSizeUniformDataAxissignal axis
I would expect that if we improve the structure and the consistency of how we defined the axis and signals, the implement of depending features would be more simple.
I didn't review the slicing and drawing code, because I think that we need to focus on the relationship between axes, axes_manager and signal first. Would it make sense to make another PR with only change related to the latter and then we can rebase/cherry pick the changes of this PR?
| is organized as a collection of vectors of some length. These arrays are ragged, such | ||
| that they can have arbitrary length but constant width. Vectors in hyperspy usually | ||
| represent pixel positions related to some Signal. Like Signals, they can have signal dimensions | ||
| return |
| The :py:method:`~._signals.vector_signal.BaseVectorSignal.cluster` is designed to take | ||
| some `ClusterMixin <https://scikit-learn.org/stable/modules/generated/sklearn.base.ClusterMixin.html#sklearn.base.ClusterMixin>` |
There was a problem hiding this comment.
Use intersphinx, something along the line of (need checking):
| The :py:method:`~._signals.vector_signal.BaseVectorSignal.cluster` is designed to take | |
| some `ClusterMixin <https://scikit-learn.org/stable/modules/generated/sklearn.base.ClusterMixin.html#sklearn.base.ClusterMixin>` | |
| The :py:meth:`~._signals.vector_signal.BaseVectorSignal.cluster` is designed to take | |
| some :py:class:`sklearn.base.ClusterMixin` |
|
|
||
| The :py:method:`~._signals.vector_signal.BaseVectorSignal.cluster` is designed to take | ||
| some `ClusterMixin <https://scikit-learn.org/stable/modules/generated/sklearn.base.ClusterMixin.html#sklearn.base.ClusterMixin>` | ||
| object which has a method `fit_predict` which returns a set of labels. More information on the |
There was a problem hiding this comment.
| object which has a method `fit_predict` which returns a set of labels. More information on the | |
| object which has a method :py:meth:`sklearn.base.ClusterMixin.fit_predict` which returns a set of labels. More information on the |
|
|
||
| The Vector class is a new class added in version 2.0 which is designed to store data which | ||
| is organized as a collection of vectors of some length. These arrays are ragged, such | ||
| that they can have arbitrary length but constant width. Vectors in hyperspy usually |
There was a problem hiding this comment.
It may be worth covering in more details the difference between ragged and vector in its own section, as this can be easily confusing! A cartoon showing the possible navigation / signal dimensions may be good here.
| # Add missing vector | ||
| for s in signals: | ||
| if "vector" not in signals[s]: | ||
| signals[s]["vector"]=False |
There was a problem hiding this comment.
Since this is going to be release with 2.0, I should suggest to remove this and update signals specifications.
| x = da.empty(shape=(4), dtype=object) | ||
| for i in np.ndindex(x.shape): | ||
| x[i] = da.random.random((6, 4)) | ||
| s = L(x).T |
There was a problem hiding this comment.
What is L? This fixture doesn't seem to be used, but it would add test for lazy signal!
| @@ -367,7 +370,7 @@ def _get_dask_chunks(self, axis=None, dtype=None): | |||
| dc = self.data | |||
| dcshape = dc.shape | |||
| for _axis in self.axes_manager._axes: | |||
| if _axis.index_in_array < len(dcshape): | |||
| if _axis.index_in_array != () and _axis.index_in_array < len(dcshape): | |||
There was a problem hiding this comment.
| if _axis.index_in_array != () and _axis.index_in_array < len(dcshape): | |
| if not isinstance(_axis, VectorDataAxis) and _axis.index_in_array < len(dcshape): |
| @@ -382,7 +385,8 @@ def _get_dask_chunks(self, axis=None, dtype=None): | |||
| elif not isinstance(dtype, np.dtype): | |||
| dtype = np.dtype(dtype) | |||
| typesize = max(dtype.itemsize, dc.dtype.itemsize) | |||
| want_to_keep = multiply([ax.size for ax in need_axes]) * typesize | |||
| want_to_keep = multiply([ax.size for ax in need_axes | |||
| if ax.size != Undefined and ax.size > 0]) * typesize | |||
There was a problem hiding this comment.
| if ax.size != Undefined and ax.size > 0]) * typesize | |
| if not isinstance(ax, VectorDataAxis)]) * typesize |
| @@ -449,7 +453,7 @@ def get_chunk_size(self, axes=None): | |||
| if not np.iterable(axes): | |||
| axes = (axes,) | |||
|
|
|||
| axes = tuple([axis.index_in_array for axis in axes]) | |||
| axes = tuple([axis.index_in_array for axis in axes if axis.index_in_array is not ()]) | |||
There was a problem hiding this comment.
| axes = tuple([axis.index_in_array for axis in axes if axis.index_in_array is not ()]) | |
| axes = tuple([axis.index_in_array for axis in axes if not isinstance(axis, VectorDataAxis)]) |
| # These traits need to added dynamically to be removed when necessary | ||
| self.update_axis() | ||
| self.size = -1 | ||
| self.vector = True |
There was a problem hiding this comment.
Don't think, we need to keep it?
| self.vector = True |
|
@ericpre that sounds like a good idea. I can resubmit a PR with just the changes to the Axes, axes manager and the signal. I'll see what I can do tonight and tomorrow. I'll try to reply to some of the other comments then. Defining a I've gone back and forth on how to represent these columns. While each column usually maps to some axis in a signal, it's more of a
|
|
Maybe it's best to start with the use cases: 1: Ragged signal of vectors with constant number of columns. (Think something like the results from 2: Non-ragged signal with specific column information. (Think like a center of mass calculation with an x and a y column) 3: Pure list of vectors. This is closest to a There are additional questions like can you have |
|
@ericpre I've looked over this a little bit more and I think that the best course of action is to create a new class The previous implementation is kind of a hacky way to treat columns of some dataset as axes. While that works well from the standpoint of consistent methods for operating on vectors and signals I think it limits the functionality of labeled column values. I'll start with my idea for a treatment of ragged axes and go from there:As far as ragged axes go. I think it makes sense that every type of axis can be cast to a raggedAxis. The idea there is that ragged axes define a consistent array inside of another array. So for some axes_manager which is ragged the default it to assume that there is no underlying structure to the ragged array. In the case of a different sized 2D array at every navigation position this can be defined as two Lets try some more examples but with Labeled ColumnsCase 1: This case and case 3 are just extensions of each other. In the simplest case lets say you have some center of mass data: Then if you wanted all of the "cx" data you could go: Case 2: For a ragged set of vectors then we could imagine something like this: In this case we have ragged signal dimensions. This makes things like slicing or indexing a little more difficult. We could still do the same thing but this requires us to go through every array using a for loop which isn't that fast. Case 3: This is just an extension of case1 where an additional "Index" axis is added. Lets start with something like a non ragged signal of vectors (x, y, kx and ky). In this case we have a two dimensional array (nx4) when n is the number of vectors(lets just say 10 in this example) In this case we would have an axes manager that looks like this Then if we wanted to index the array we could use the following syntax s.isig["x"] # get just the x column
s.isig["x", :2] # get just the x column and first 2 vectorsOf course the functionality that we are probably more interested in is something like this: But maybe that deserves some more discussion. |
|
@CSSFrancis, please comment or correct me: case 1Can you specify what do you mean with center of mass? Are you talking about severals center of mass per navigation index? case 2
case 3
|
|
@ericpre Sorry I think this was maybe overly confusing. I was still trying to figure things out. Basically I tried to figure out the non ragged case first with the idea and then apply that same idea to ragged signals. Specifically ragged signals with the same dimensions in the sub array but not necessarily the same shape
In this case no that is not a ragged axis. That is just an axis with a set of labeled columns. This can be implemented similar to how we handle nonlinear axes. In this case the scale and the offset operate on the array values and no the index. The array shape would be something like (10,10,2) as you said.
This is the only truly ragged case. In this case there are 4 axes 2 in the array and always 2 in the sub array. I define the two in the sub array as being ragged. That is kind of confusing because like you said they don't have to be ragged. So maybe something like called them subarray axes makes more sense. One of the axes has a constant size while the index can be any size. The one with constant size we can label the columns and calibrate it that way.
Like you said this is already fairly possible. The only change necessary is to make the non linear axis accept anything and not be constrained to strictly increasing axes/not care if the indexes aren't values. I set this example similar to how pandas deals with data. The idea being that for a 2 d array you have two axes. One which is labeled columns and the other which is and index. Theoretically you could actually import as pandas dataframe into hyperspy with this change and it would look similar to this. I'm trying to get some working code examples up and maybe that will make things less confusing. The fundamental changes necessary for this are small, some of the axes functions need to be rearranged to allow for a nonlinear axis to accept any values in the axis parameter but after that things should work well in the non ragged case. For the ragged case there is no reason those axes shouldn't look the same but describe a constant sub array |
Description of the change
This change is motivated by the fact that the ragged signal is kind of lacking these days. #2856 Talked about this but also this has come up in other places pyxem/pyxem#789.
In a broader sense the
find_peaksfunction should probably return a list of peak positions in pixel units, but should also have access to the calibration. My thought is that any dimension of vector should be accepted.What I have implemented is a Vector signal class which is just an extension from a ragged signal except that it has a number of special VectorDataAxes for the signal_axes rather than not having any signal axes.
I also implemented a couple of methods for changing the vector into real units and transforming the navigation axis into vectors as well. The thought process behind this is because this allows the user to use the
cluster()method to combine vectors along whatever dimensions they want. The idea here is that there are lots of tools fromsklearnthat label vectors which we could utilize to compare vectors along multiple dimensions.Progress of the PR
upcoming_changesfolder (seeupcoming_changes/README.rst),readthedocsdoc build of this PR (link in github checks)Minimal example of the bug fix or the new feature
<VectorSignal, title: , dimensions: (4|1, 1)><VectorSignal, title: , dimensions: (4|1, 1)>@pc494 @hakonanes @magnunor Any suggestions or features you are interested in would be helpful.
@ericpre any advice implementing a VectorDataAxis would be nice as well.
Long term my goal is to replace the
diffraction_vectorsclass in pyxem with something that is more flexible and intuitive as well as something that can save all of the data.