This is the second course project for the Winter 2018 course - ECS272 Information Visualization at UC Davis.
- Winter 2018
DEMO Site: https://hipposerver.ddns.net:8802/
In this project, we will apply some natural language processing (NLP) technique to a text-oriented dataset, and then design a dashboard to visualize and analyze the results of this NLP application. The datasets are provided by the professor and the student are allowed to choose one of the given datasets. For this project, I chose to use the Yelp dataset.
The link to the datasets:
This project is required to have the followings be completed:
- to use at least 1 NLP techniques
- to use at least 3 visualization techniques showing the data
- each visualization should have at least 2 levels of granularity
Library used:
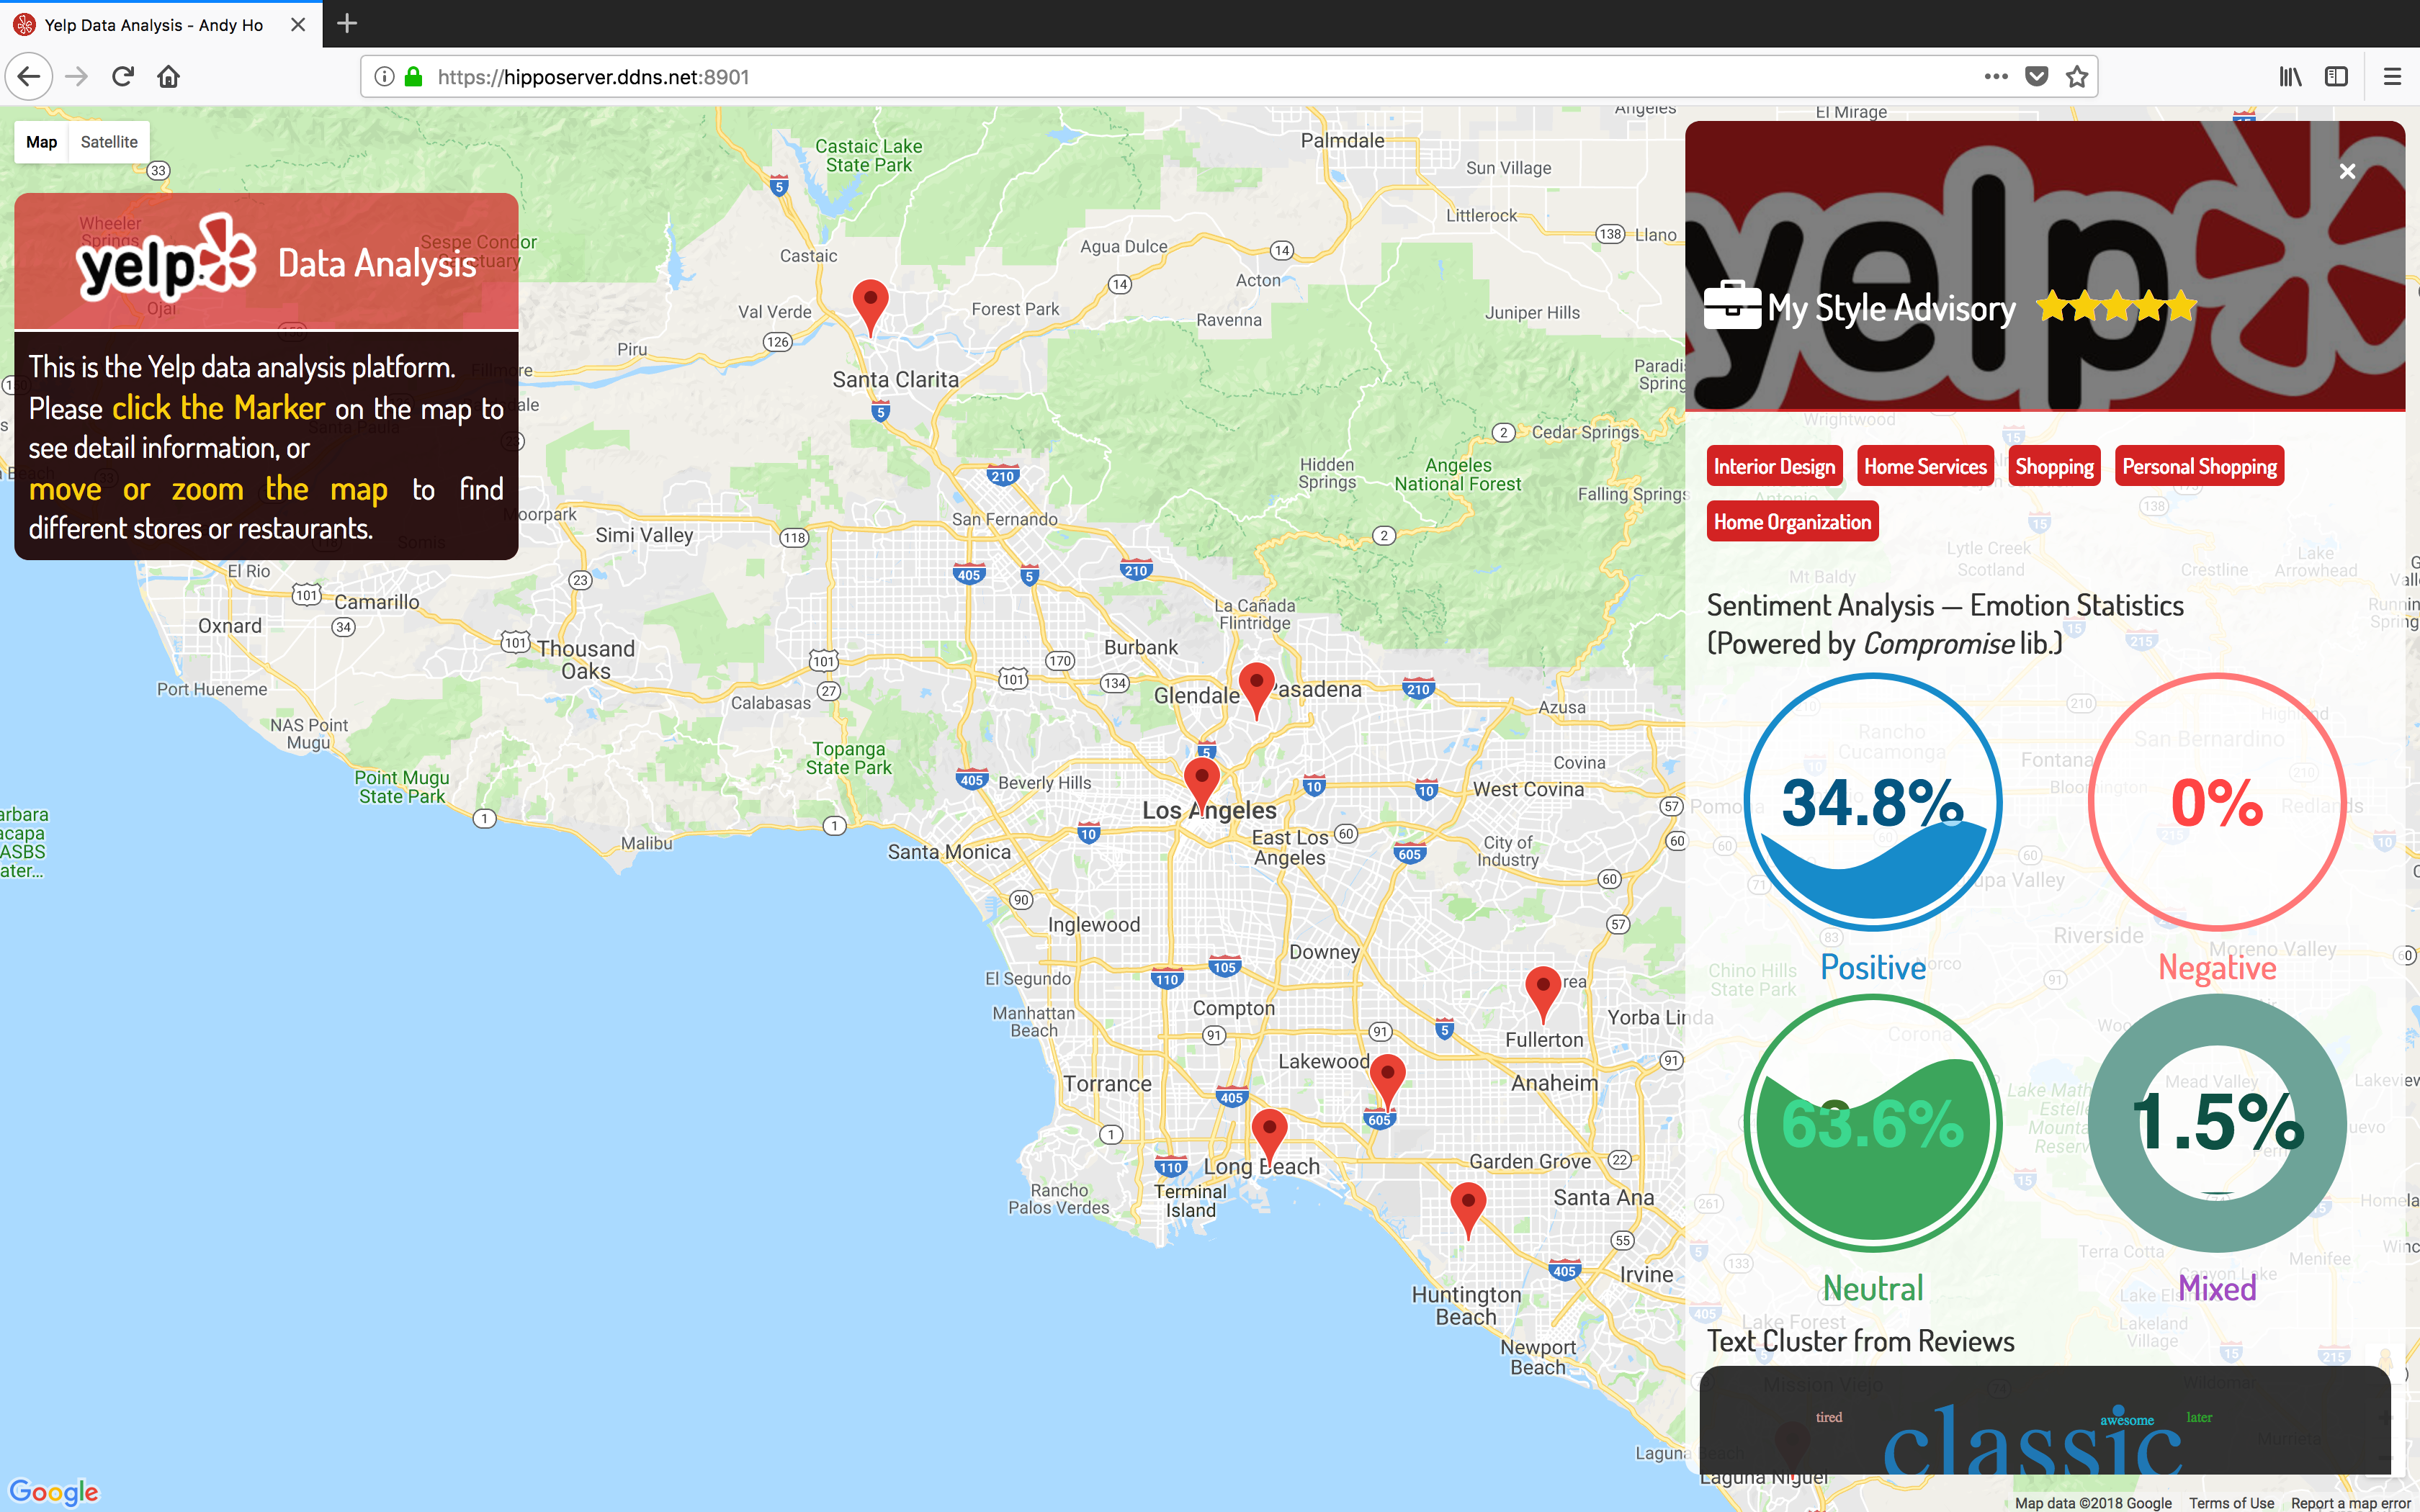
The main interface of this system is a map powered by Google Maps API. The markers are added based on the current scope of map and the availability of the business data.
The functionalities of this system are:
- clikc one of a marker on the map to trigger a side panel to show up
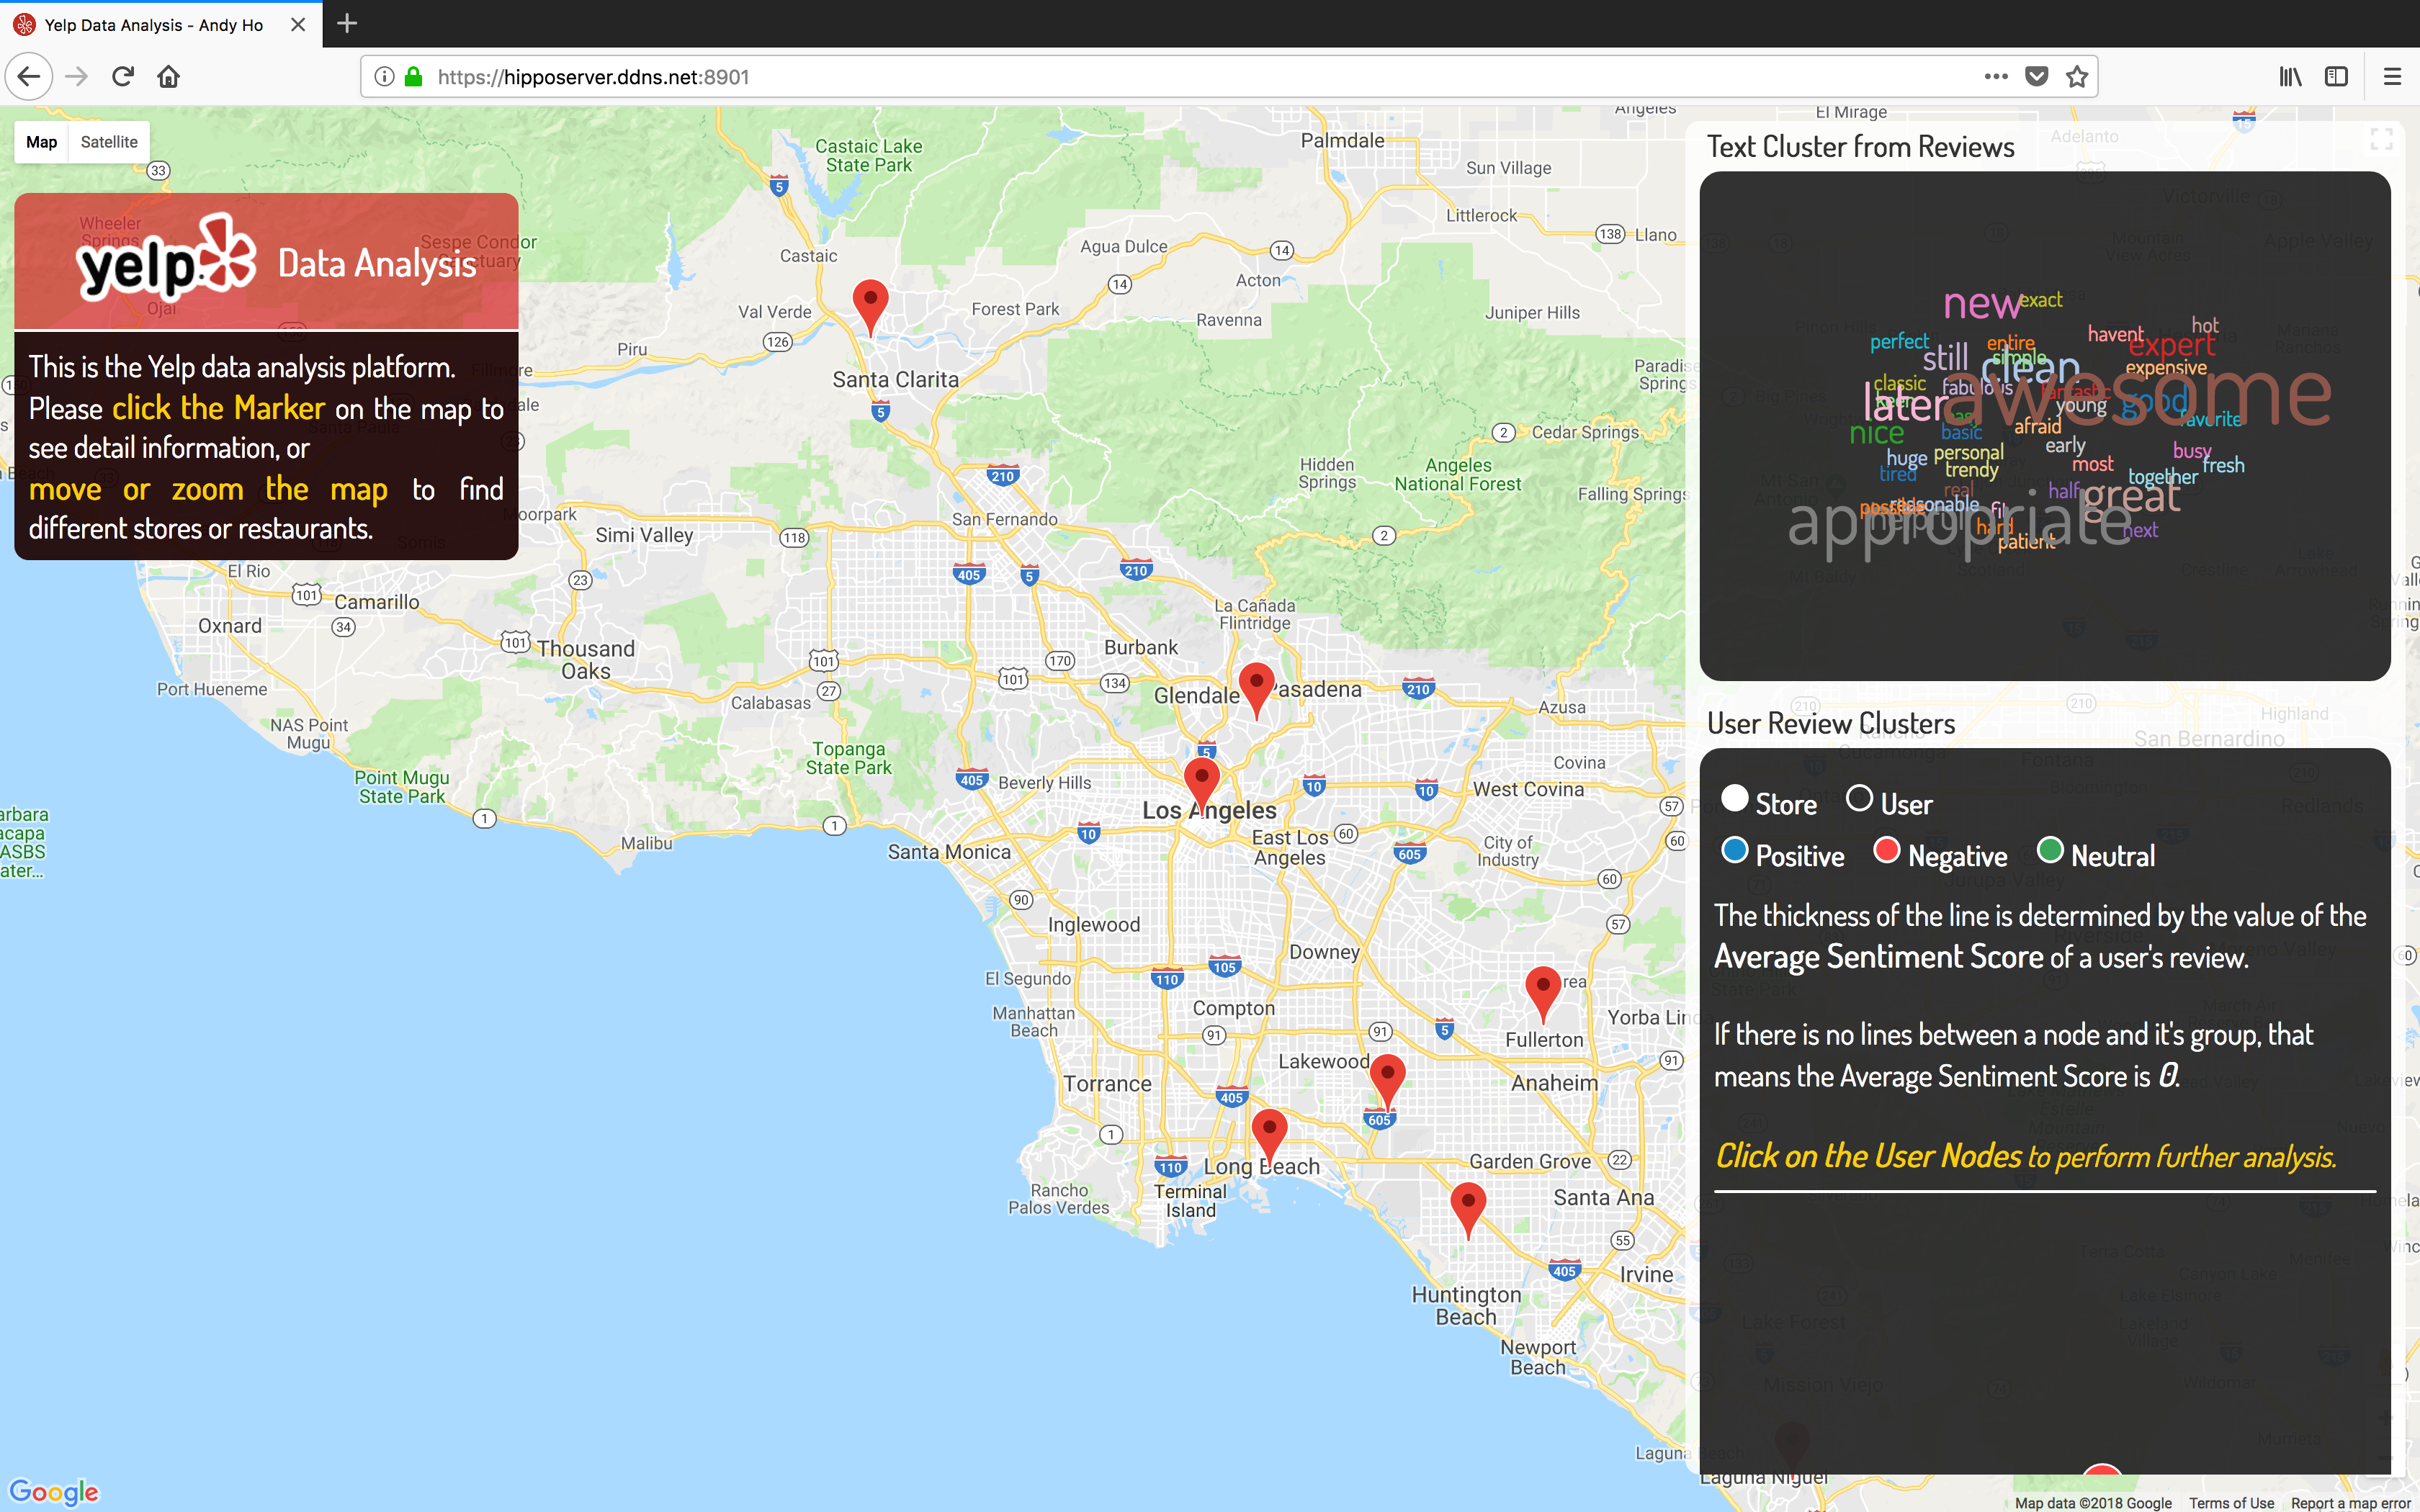
- see the NLP visualization on the side panel (Powered by Compromise lib.)
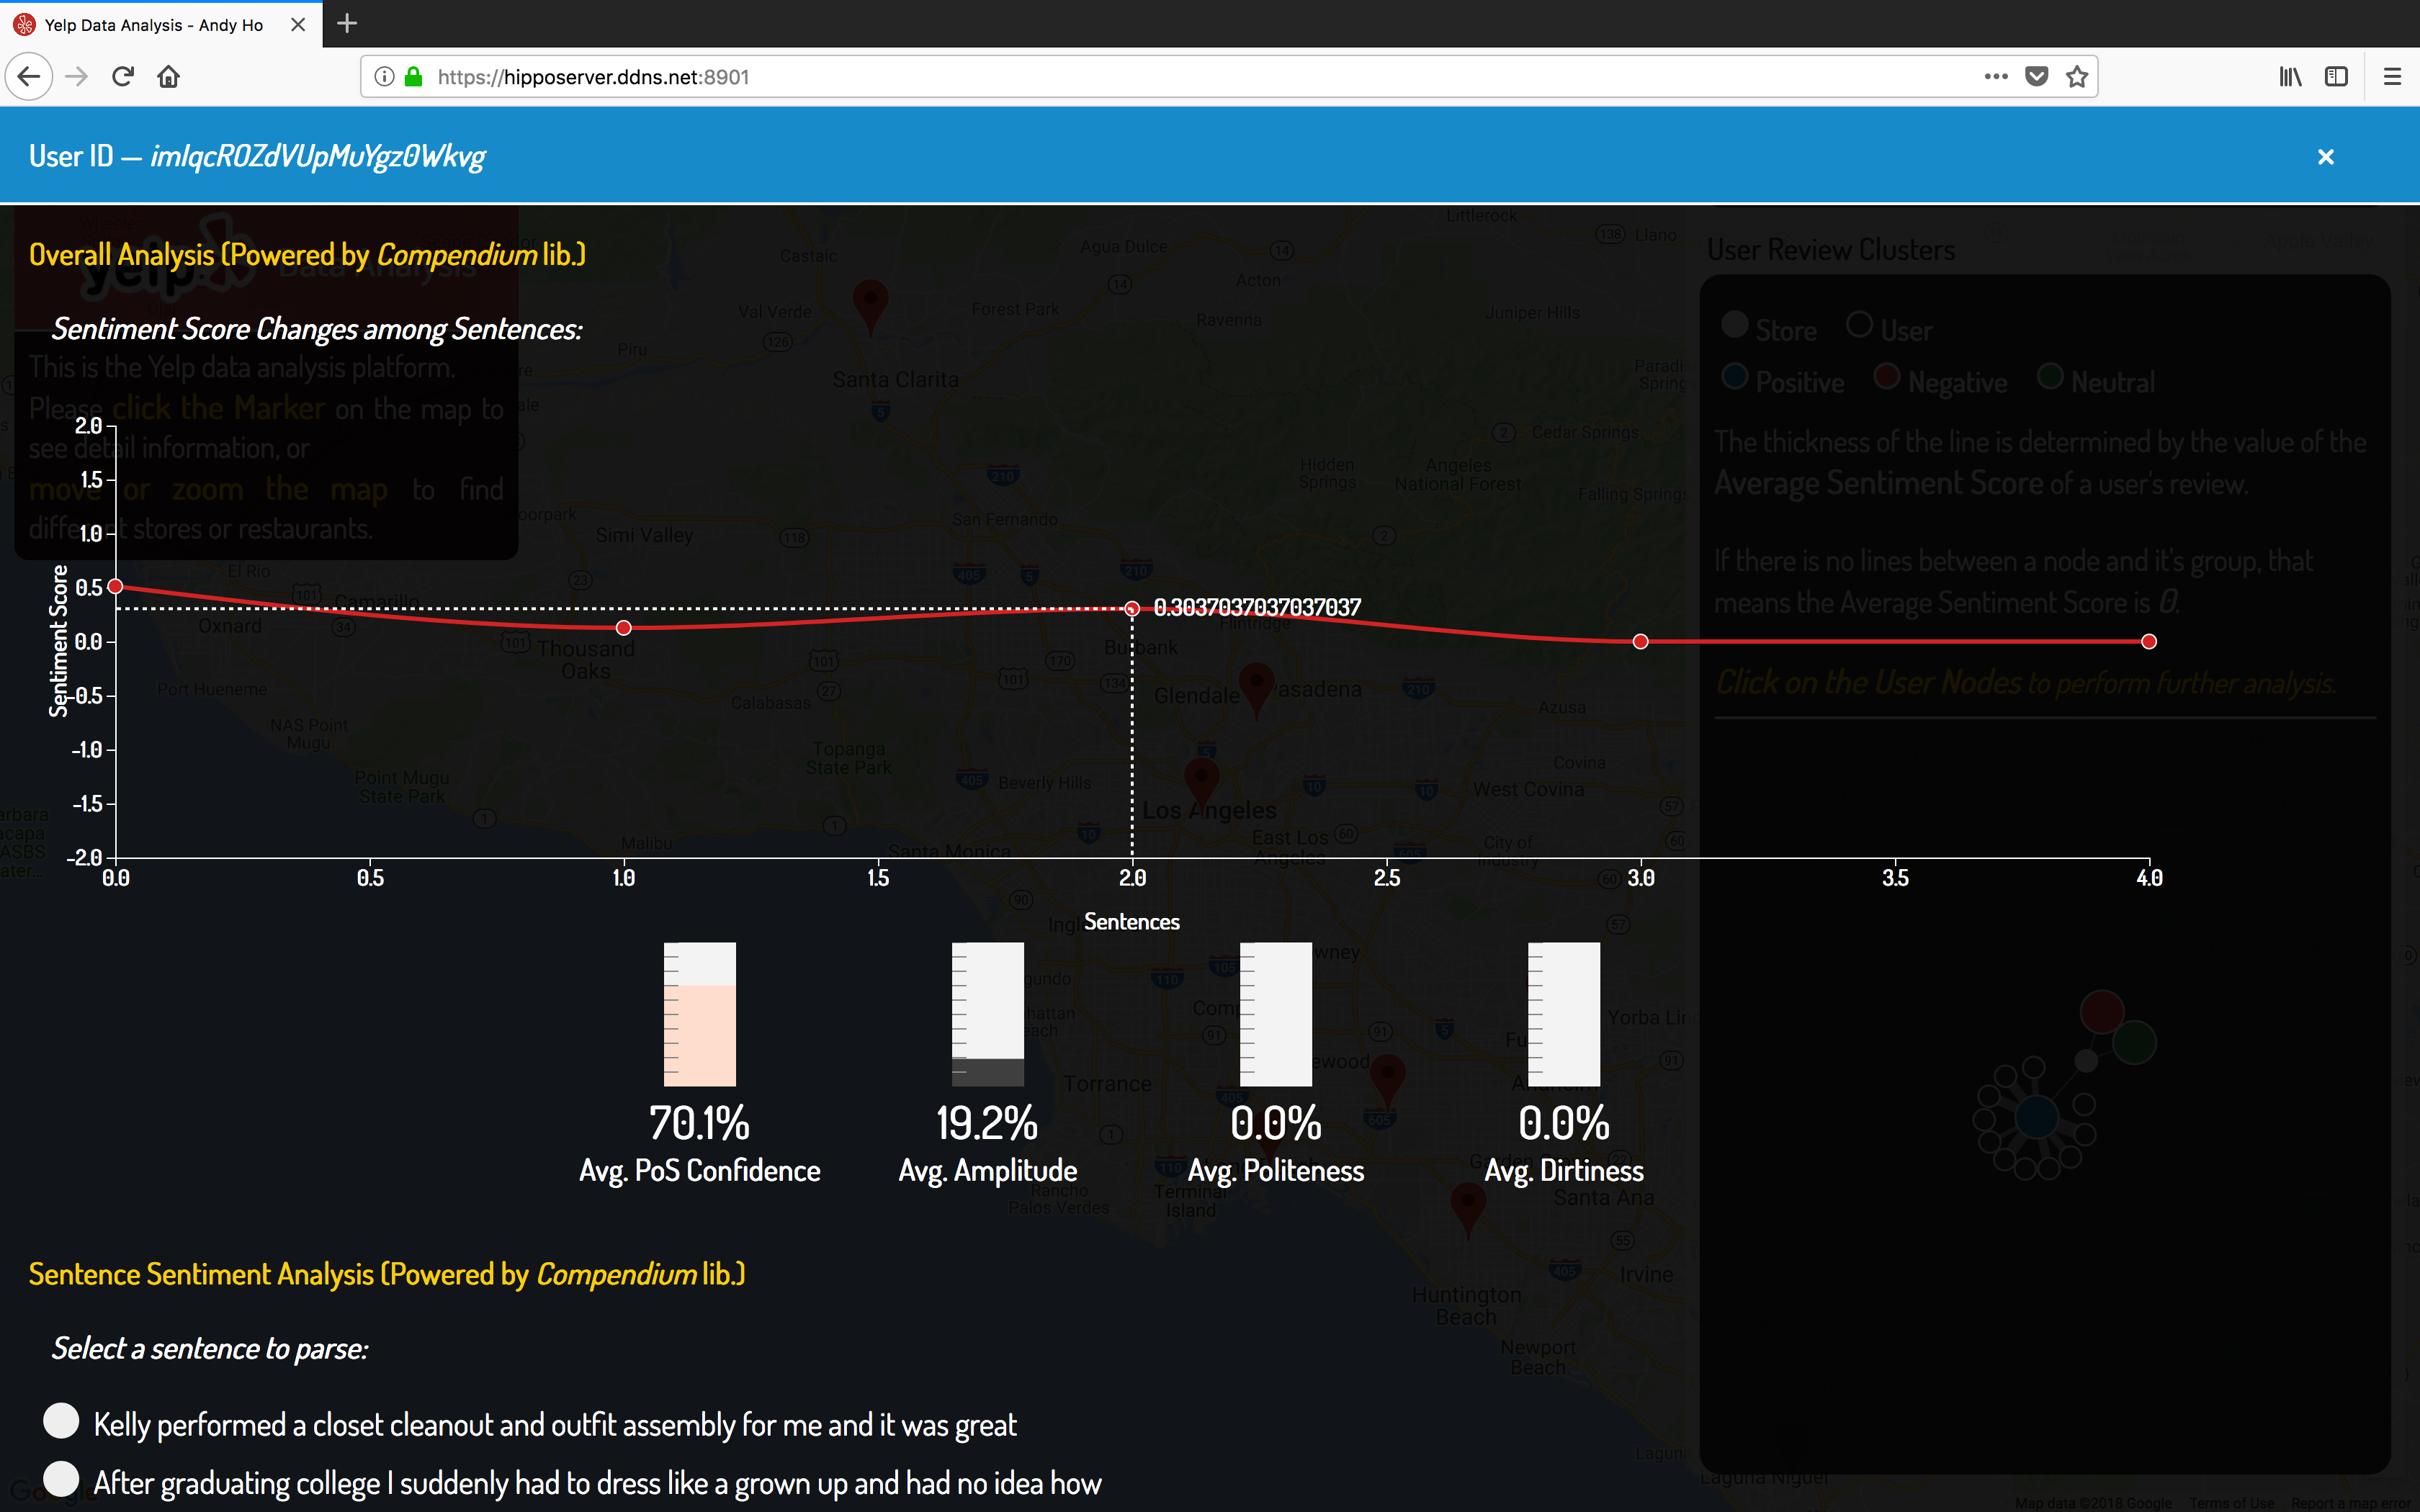
- click on the user node in the graph chart will trigger another panel to show detail analysis
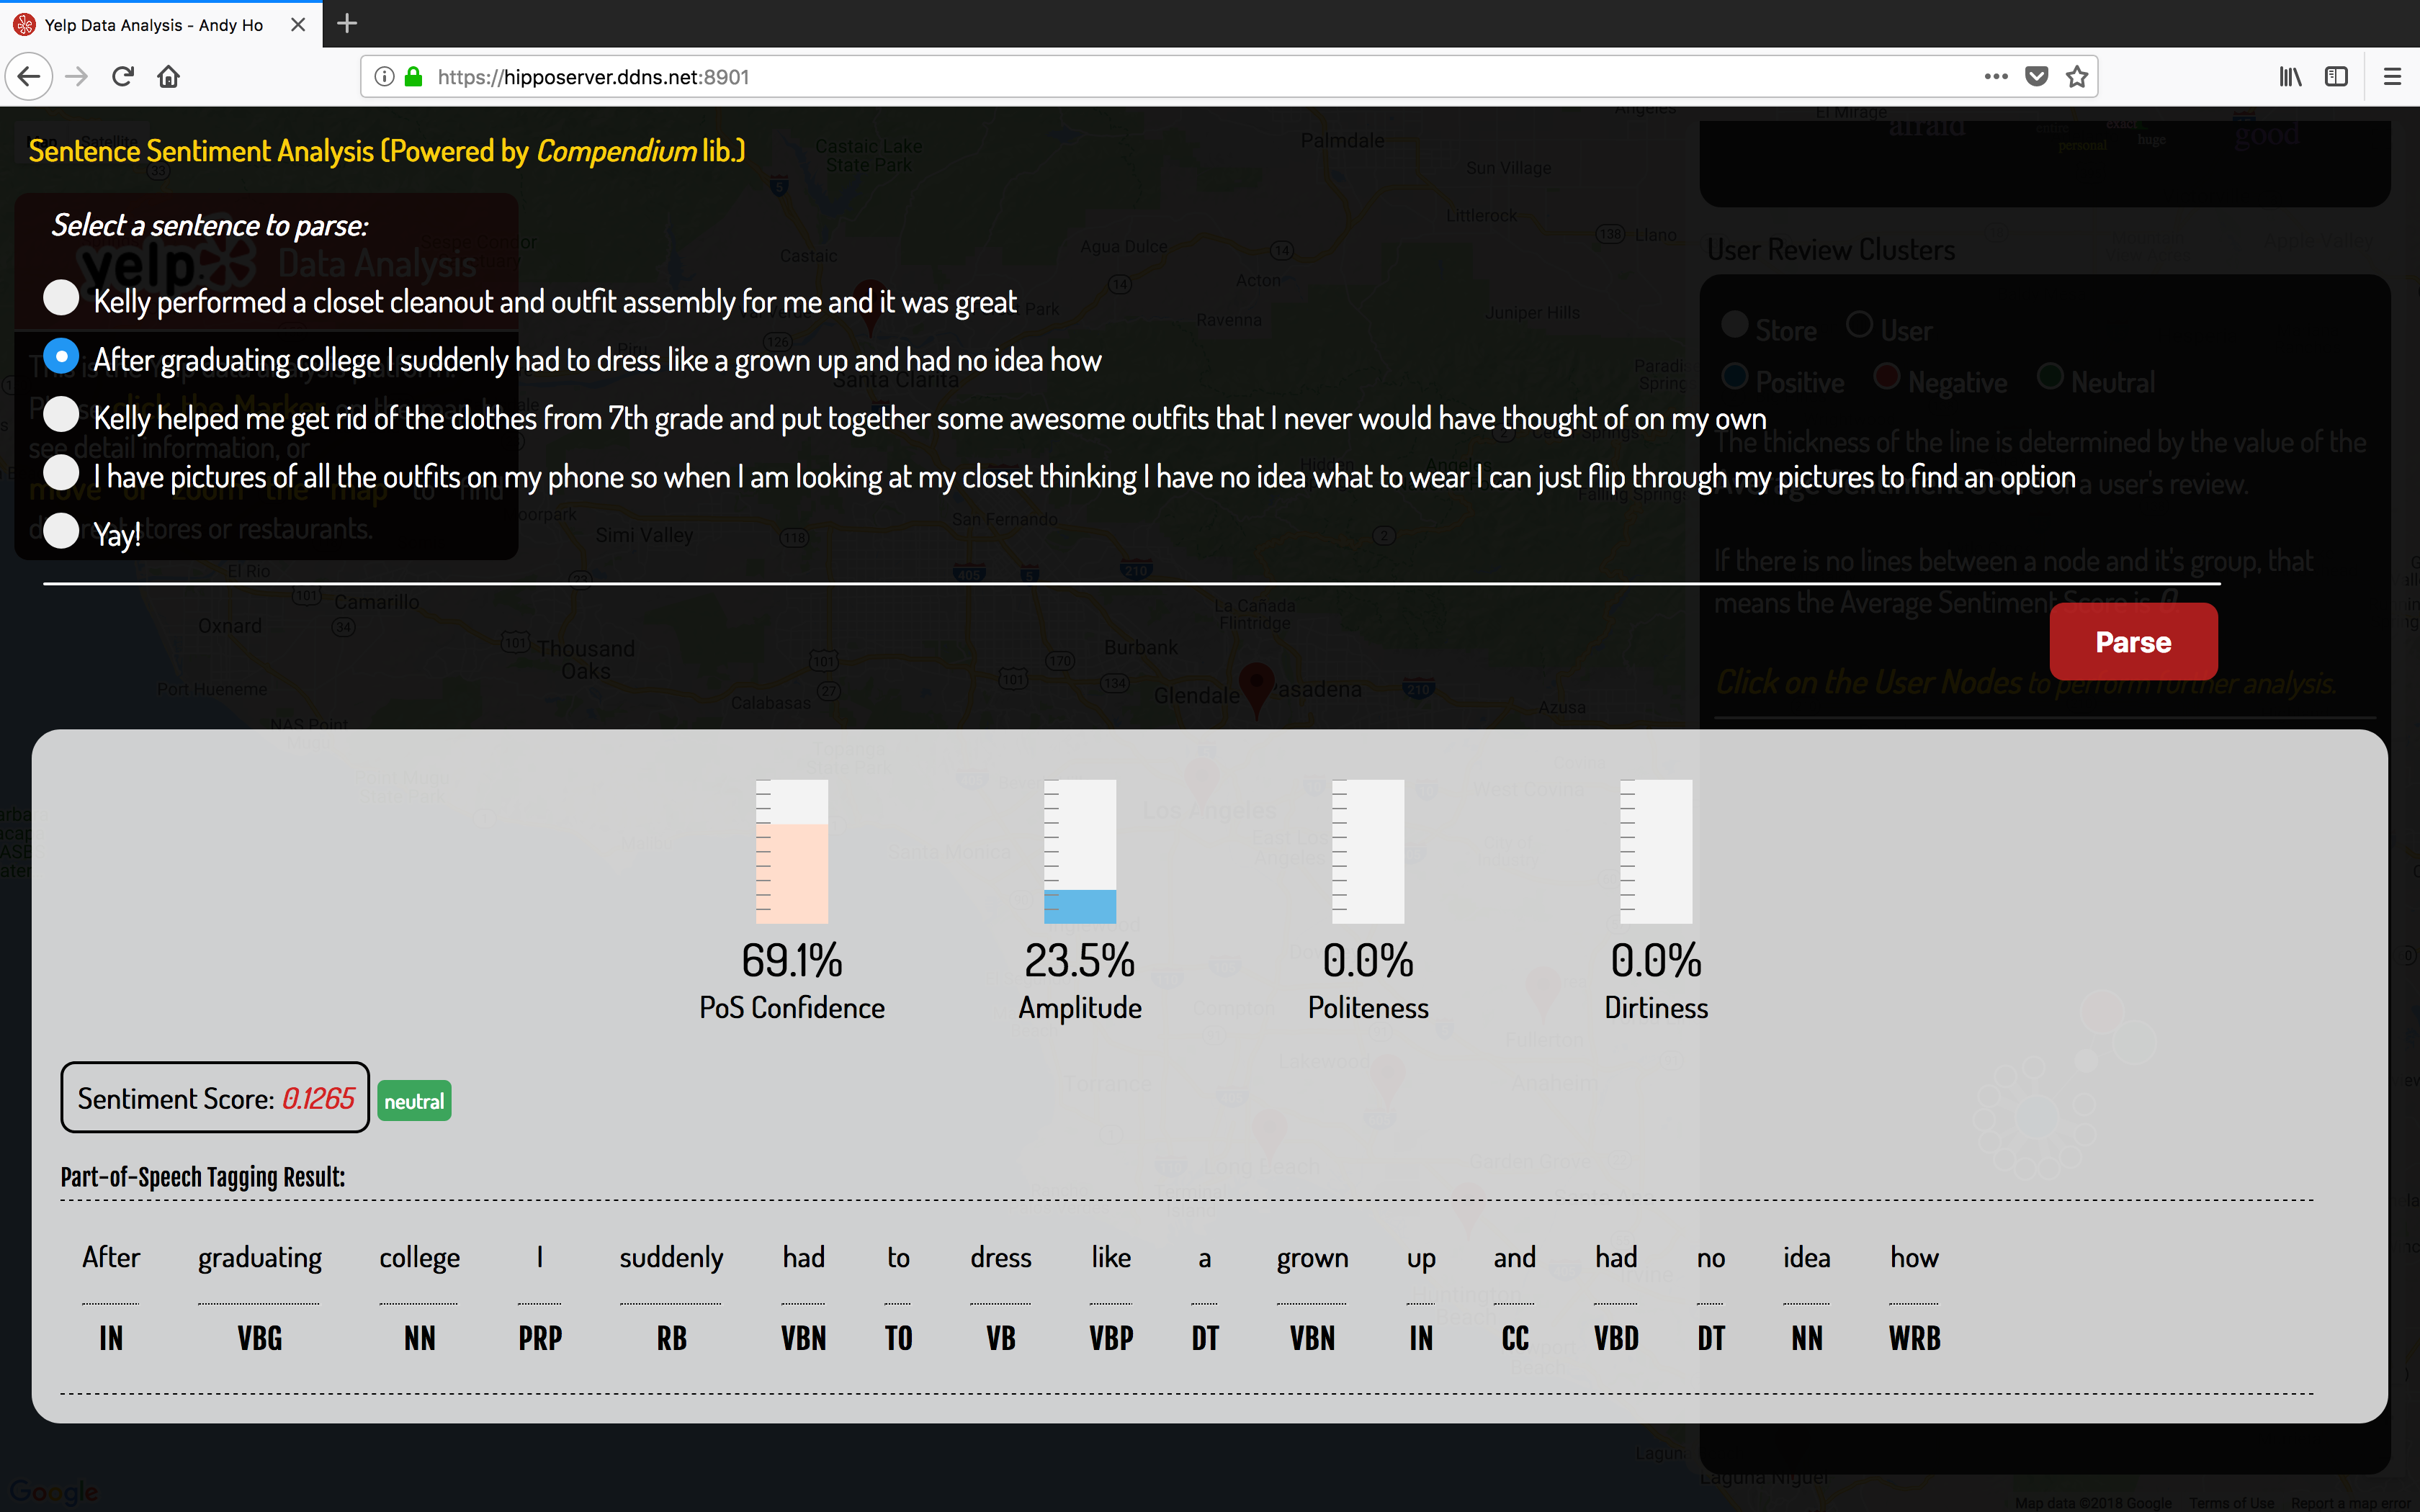
- see the NLP visualization on the side panel (Powered by Compendium lib.)
- select a sentence to further parse it. (Powered by Compendium lib.)