This experiment simulates data ingestion of bid requests to a serverless data lake and data analytics pipeline deployed on AWS. As a result, you get a real-time dashboard and a BI tool to analyze your stream of bid requests. Overview of the real-time dashboard.

Services in use:
- Amazon Kinesis Data Firehose for data ingestion,
- Amazon Kinesis Data Analytics for data enhancement,
- Amazon S3 for data storage,
- AWS Lambda for publishing near real-time measures,
- Amazon QuickSight for data visualization,
- Amazon CloudWatch for near real-time data visualization,
- AWS Fargate for simulating bid requests.
Data used for this experiment are coming from the Kaggle Display Advertising Challenge Dataset published in 2014 by Criteo. If you are curious or if you want to push the Criteo Dataset further, you can refer to their 2015 announcement and the related download.
Every time it is possible, this experiment leverages AWS CDK to deploy the required infrastructure.
- Architecture overview
- Prerequisites
- Deployment of the experiment
- Exploring the demo
- Cost
- Solutions alternatives
- Develop
- Clean up
- Inspiring source of information
- Producer: AWS Fargate simulates bid request pushes to Amazon Kinesis Data Firehose from the TSV "mock" file
- Ingestion: Amazon Kinesis Data Firehose ingests the data into Amazon S3
- Enhancement: Amazon Kinesis Data Analytics
- enhances the data with catalog stored in Amazon s3
- computes counters from the ingestion stream of records
- triggers an AWS Lambda function to store real-time counts in Amazon CloudWatch
- Visualization:
- Amazon CloudWatch allows viewing of custom near real-time metrics
- Amazon Quick Sights allows reporting on raw data stored in Amazon S3

For this experiment, you will need the following:
- The AWS CLI
- An AWS account. If you don't have an AWS account, you can create a free account here.
- Node.js (>= 8.10). To install Node.js visit the node.js website. You can also install the node version manager: nvm
- The AWS CDK toolkit:
$> npm install -g aws-cdk
If this is the first time you deploy a CDK application in an AWS environment, you need to bootstrap it: cdk bootstrap. Please take a look at the bootstrap section of the CDK workshop.
To deploy this experiment in your account, you have four actions to take:
- Download necessary data
- Build the CDK application
- Deploy the stack and upload the data
- Deploy Amazon QuickSight
Download the data and extract the zip file to the data directory.
Important: we don't want to upload the whole dataset. Therefore we are taking a small amount of it with the following command in the data directory:
$> head -5000000 train.txt > bidrequests.txtData fields explanation:
- C0 (Integer) - Indicates if an ad was clicked (1) or not (0).
- C1-C13 - 13 columns of integer features mostly representing count features.
- C14-C39 - 26 columns of categorical features. The values of these features have been hashed onto 32 bits.
At the root of the repository:
$> npm installThis will install all the AWS CDK project dependencies.
$> npm run buildThis command will build the CDK application: compile Typescript code into Javascript.
To deploy the CDK application:
$> cdk deployThis command will generate a cloud formation stack that will be pushed to your configured account. This will create around 60 resources (Roles, Streams, Lambda functions, Container Registry, etc.) and will also upload prepared data to the AWS Cloud.
Actual limitations:
- If you change parameters or code of the CloudWatch's dashboard, you must delete it in the console before deploying the update with
cdk. - The Cloudwatch's dashboard is configured for certain input and output ids of the Kinesis data analytics application. If the deployed dashboard doesn't work, please check the current
inputIdandoutpuIdof the Kinesis data analytics application (with:aws kinesisanalytics describe-application --application-name EnhancementSQLApplication), update the./cdk/lib/visualization-construct.tsaccordingly and deploy the CDK application.
In order to deploy the Amazon QuickSight dashboard, you must do the following:
- Preparing a
manifest.jsonfile - Signing-up
- Creating a dataset
A prerequisite to the deployment of Amazon QuickSight using a S3 bucket is that the data actually exists in the bucket. So, please follow this part once you have launched the data producer.
On your local computer, edit the manifest.json file in the visualization folder. Use the output DataExperimentStack.VisualizationLayerQuickSightManifestFile of the deployed stack or replace XXXXXXXXXXXXX with the URi of you bucket in the provided manifest.json file.
For more information on the Manifest file, please have a look to Supported Formats for Amazon S3 Manifest Files.
If you have already signed up for Amazon QuickSight or you haven't selected this experiment raw data bucket during the sign-up, please allow QuickSight to read the bucket of this experiment. You can find the bucket name in the output of the cdk deploy command line or from the Cloud Formation console.
In this section, you are going to create a new QuickSight dataset using Amazon S3 files.
From the QuickSight home page:
- Click on "Manage Data"
- Click on "New Data Set"
- Select "S3"
- Enter a "Data Source Name" and select your local
manifest.jsonfile.

- Click "Connect"
You should see the following screen:

The QuickSight "deployment" is finished. For an exploration of Quicksight, see Exploring the demo.
Once the import is finished, you will get the following screen:

Note: Amazon QuickSight has certain Data Source Limits. In particular, the total size of the files specified in the manifest file can't exceed 25 GB, or you can't exceed 1,000 files. Therefore, as we are pointing to row data, we should only indicate a particular day in the manifest.json file. For instance:
{
  "fileLocations": [
    {
      "URIPrefixes": [
        "https://s3.us-east-1.amazonaws.com/dataexperimentstack-bidrequestexperimentstoragecc-XXXXXXXXXXXXX/raw-data/2019/09/01/"
      ]
    }
  ],
  "globalUploadSettings": {
    "format": "TSV",
    "delimiter": "\t",
    "containsHeader": "false"
  }
}Before starting the exploration of the demo, let's launch the producer and application. This will populate the demonstration with data, and we will have something to look at.
As part of the demo, we have deployed a lambda function to simplify the launch of the producer running on AWS Fargate.
To launch the producer, execute the command line that you get as an output of the deployed demo in the output named DataExperimentStack.ProducerLayerlaunchProducerOnMacOS or DataExperimentStack.ProducerLayerlaunchProducerOnLinux. On MacOS, it will look like this.
$> aws lambda invoke --function-name arn:aws:lambda:us-east-1:XXXXXXXXXXXX:function:DataExperimentStack-ProducerLayerProducerLauncherD-XXXXXXXXXXXXX --payload '{}' /tmp/out --log-type Tail --query 'LogResult' --output text | base64 -DAs an output, you get the ARN of the running task.
Note: If you encounter the following error "Unable to assume the service linked role. Please verify that the ECS service linked role exists." while launching the producer, please follow instructions here and create the linked service role:
$> aws iam create-service-linked-role --aws-service-name ecs.amazonaws.comIn order to get enhanced results and real-time metrics, you need to also launch the Kinesis Data Analytics Application. To do so, execute the following command:
$> aws kinesisanalytics start-application --application-name EnhancementSQLApplication --input-configurations Id=1.1,InputStartingPositionConfiguration={InputStartingPosition=LAST_STOPPED_POINT}Depending on the number of deployments and changes you made to the following CDK application, the input Id of the Kinesis Data Analytics application may change. You can get the right InputId with the following command: aws kinesisanalytics describe-application --application-name EnhancementSQLApplication.
Note: you can also stop the application with the AWS CLI with the following command line:
$> aws kinesisanalytics stop-application --application-name EnhancementSQLApplication
The data are pushed to Amazon Kinesis from a producer layer based on a python program running into a container on AWS Fargate.
The key components of the producer are:
- A virtual private cloud to host your producer (not detailed here),
- A lambda function that ease the launch of the producer,
- A container registry to host the Docker image of the producer (not detailed here)
- A task definition which defines how to run the producer,
You can get a list of all resources deployed related to the producer in the Cloud Formation console for the stack DataExperimentStack and searching for "Producer" in the resources search field.
AWS Lambda is a compute service that lets you run code without provisioning or managing servers.
In the present case, we use AWS Lambda to launch the Fargate Task from all the necessary information provided at deployment time by the CDK application:
- The ECS cluster
- The private subnets of the newly launched VPC
- The task definition
To access the deployed lambda function:
- Go to your AWS Account,
- Search for Lambda,
- Look for a function name starting with
"DataExperimentStack-ProducerLayerProducerLauncher" - Click on the function name
You will see the following screen:

If you scroll down the page, you will notably see the "Environment variables" that are provided to the lambda function at deployment time and necessary to launch the Fargate Task.

AWS Fargate is a compute engine for Amazon ECS that allows you to run containers without having to manage servers or clusters.
In the present case, we leverage AWS Fargate to host the program that will continuously - until we stop it or it has pushed all records - push records to the Kinesis Firehose ingestion stream.
- Search for the ECS service,
- Click on "Clusters" on the left panel
- Search for "Producer"

- Click on the cluster name, then on the "Task" tabulation. You get the following screen.

- Click on the "Running" task

From here, you can check the status of the task and access logs.
Troubleshooting: if you want to check that your producer is effectively and successfully sending events to your ingestion layer, you can look at the logs of your Fargate task. If everything is going well, you will read messages like "SUCCESS: your request ID is : ebc2c2b9-c94a-b850-be24-30ee9c33a5e7".

The data generated by the producer are pushed to an ingestion layer made of:
- A Kinesis Data Firehose delivery stream
- A destination S3 bucket for raw data
Amazon Kinesis Data Firehose is a fully managed service to load streaming data into data stores and analytics tools. It can capture, transform, compress, and load streaming data into various destination such as Amazon S3 or Amazon Elasticsearch Service. It automatically scales to the load. Further details here.
- Open the Kinesis Dashboard.

- From here, open the
"BidRequestExperimentIngestionLayer"kinesis delivery stream - Inspect the details of the stream, in particular, take a look at the Amazon S3 destination configuration

The buffer conditions of "128 MB or 60 seconds" mean that the data will be written to AWS S3 every 60 seconds or when the buffer reach 128 MB. In our case, data are written to S3 every 60 seconds. See in the next paragraph.
- Click on the
"Monitoring"tabulation

This tabulation provides a monitoring view of the stream like the number of "Incoming records" per minutes or the "Incoming Bytes". You can access all Firehose and delivery stream metrics in AWS Cloudwatch.
Amazon Simple Storage Service (S3) is a storage solution designed for the Internet scale. In this experiment, S3 is a fully managed serverless data lake. It automatically scales, and you don't need to provision any storage space.
- From the Kinesis Firehose delivery stream details page, click on the S3 bucket link from the "Amazon S3 destination" section.
- Open the
"raw-data"folder then navigate the structure up to a list of files.
Firehose has been configured to prefix all data with "raw-data" in S3. All data are pushed according to this prefix and then with the date prefix: "YYYY/MM/DD/HH" UTC


The data ingested are processed through an SQL application that enhances the data from a referential stored on S3 and compute analytics on top of the initial ingestion stream. The results of this application are pushed as custom metrics in AWS CloudWatch. This enhancement layer is made of :
- A Kinesis Data Analytics SQL application,
- A Lambda function that push the results of the Data Analytics application to CloudWatch custom metrics,
- A S3 object that represents a table to add reference data into the ingestion stream.
S3 is used to store the referential file that is then connected to the Kinesis application.
- Open the Kinesis Dashboard.
- Open the
"EnhancementSQLApplication"in the Kinesis Analytics Application card.

- You can see the Amazon S3 Object as a reference data and its associated "In-application reference table name" that can be used in the SQL application (see below)
See Example: Adding Reference Data to a Kinesis Data Analytics Application for further details on the topic.
A Kinesis Data Analytics application continuously reads and processes streaming data in real-time. You write application code using SQL or Java to process the incoming streaming data and produce output(s). In our case, we use an SQL application.
Kinesis Data Analytics then writes the output to a configured destination. The following diagram illustrates a typical application architecture.
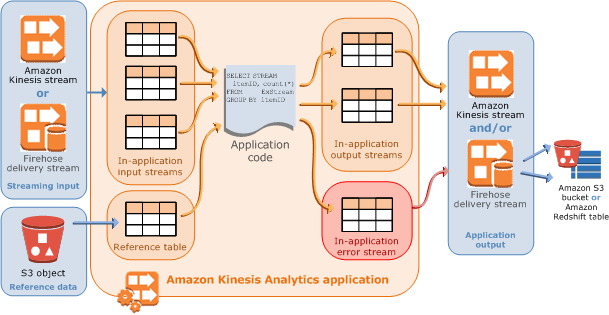
This experiment leverages as a:
- Source:
- The in-application input stream from the ingestion layer
- A reference table (see above)
- Real-time analytics:
- SQL code
- 2 in-application output streams
- Destination:
- Open the Kinesis Dashboard.
- Open the
"EnhancementSQLApplication"in the Kinesis Analytics Application card. - You can see the Firehose delivery stream as a "streaming data" and its associated "In-application reference table name" that can be used in the SQL application
- Click "Go to SQL results"

From here, you can navigate the application, edit the SQL, see incoming data, and real-time computed analytics.
SQL code:
CREATE OR REPLACE STREAM "enhanced_stream" (INGESTION_TIME BIGINT, AD VARCHAR(12));

CREATE OR REPLACE PUMP "enhanced_stream_pump" AS INSERT INTO "enhanced_stream"
      SELECT STREAM UNIX_TIMESTAMP(APPROXIMATE_ARRIVAL_TIME), "r"."REFERENCE" as "AD"
      FROM "input_stream_001" LEFT JOIN "referential" as "r"
      ON "input_stream_001"."AD" = "r"."CODE";

CREATE OR REPLACE STREAM "count_stream" (AD VARCHAR(12), INGESTION_TIME BIGINT, NBR INTEGER);

CREATE OR REPLACE PUMP "count_stream_pump" AS INSERT INTO "count_stream"
    SELECT STREAM AD, MIN(INGESTION_TIME), COUNT(AD)
        FROM "enhanced_stream"
        GROUP BY AD,
            STEP("enhanced_stream".ROWTIME BY INTERVAL '30' SECOND);
The SQL language supported by Kinesis data analytics applications is based on the SQL:2008 standard with some extensions to enable operations on streaming data such as the CREATE OR REPLACE STREAM statement that creates a stream accessible to other statements in the SQL application and adds a continuous delivery stream output to the application.
This stream can then be connected to a destination: a Kinesis stream, a Kinesis Firehose delivery stream or an AWS Lambda function.
A pump is a continuous insert query running that inserts data from one in-application stream to another in-application stream.
This SQL application is commonly named a multi-step application:
- we create a stream and extend the data with a referential
- we use that stream to perform an aggregation with a tumbling window - non-overlapping manner, here every 30 seconds.
- Open the Kinesis Dashboard.
- Open the
"EnhancementSQLApplication"in the Kinesis Analytics Application card. - You can see the Lambda function as a destination of the Kinesis Analytics application.
- Click the lambda function name

- Inspect the code that pushes custom metrics to Cloud Watch
- Open the monitoring tabulation

You notice that the lambda function is called 10 times every 5 minutes. From Using a Lambda Function as Output:
If records are emitted to the destination in-application stream within the data analytics application as a tumbling window, the AWS Lambda destination function is invoked per tumbling window trigger. For example, if a tumbling window of 60 seconds is used to emit the records to the destination in-application stream, the Lambda function is invoked once every 60 seconds.
As our tumbling window is 30 seconds, we are called two times per minutes, 10 times every 5 minutes.

The data ingested by the ingestion layer and the custom metrics generated by the enhancement layerare displayed through two distinct visualization system with different purposes:
- A Cloud Watch dashboard,
- Amazon QuickSight visualizations
Amazon CloudWatch dashboards are customizable home pages in the CloudWatch console that you can use to monitor your resources in a single view. You can include custom metrics in these dashboards.
- Open the CloudWatch console
- On the left panel click on "Dashboards"
- Click on the BidRequestRealTimeDashboard

In the above example, between 9AM and 9:30AM you can see a spike. It is because a second producer has been temporarily launched. Kinesis Data Firehose adjusts automatically to ingest the additional bid requests.
The dashboard provides two views:
- "Nbr of Bid requests per minutes": it is based on the custom metrics from the enhancement layer. It sums the values every minute.
- "Statistics over the last hour": it is based on the standard metrics provided by Kinesis Data Analytics. It sums the values over the last hour.
You can further explore the source code of the widgets and the dashboard. You can easily extend the dashboard to your will.
Amazon QuickSight is a fast cloud-native business intelligence service that makes it easy to deliver insights to everyone in your organization. It is a fully managed service, that scales automatically to your need. You pay only per editor and per viewer per session. You don't need to provision capacity unless you need extra performance.
- Go to your AWS Account,
- Search for Quicksight and open it.
- You can create and add:
- And publish and share your work as dashboards
Here is a sampled Analysis I made based on the ingested data.
 .
.
This paragraph describes the cost of this experiment for one hour of produced data by one producer detailed by layer and services. It roughly represents 270k records and 240 custom metrics (60 * 2 * 2).
All prices are for the us-east-1 AWS region.
Usage details:
- Producer:
- Ingestion
- Kinesis Data Firehose:
- Records: 270000
- Record size: 0.5KB
- Amazon S3:
- Ingested Raw Data: 0.27 GB
- Kinesis Data Firehose:
- Enhancement
- Kinesis Data Analytics SQL Application:
- KPUs: 1
- Lambda:
- Memory: 128 MB
- Duration: 32000 ms (120 * ~ 270 ms)
- Amazon S3:
- Referential file: 39 B
- Kinesis Data Analytics SQL Application:
- Visualization
- CloudWatch:
- Dashboard: 1
- Custom metrics: 2
- Custom metrics put: 240
- Amazon Quicksight:
- Admin: 1
- CloudWatch:
Total costs:
- Lambda (assuming the whole lambda free tier has been consumed):
- Cost: 121 executions * $0.0000002 + 34000 / 100 * $0.000000208 = $0
- Fargate:
- CPU charges: 1 task * O.5 vCPU * $0.04048 * 1 hour = $0.02024
- Memory charges: 1 task * 0.5 GB * $0.004445 * 1 hour = $0.0022225
- Kinesis Data Firehose:
- Total record size (each record rounded to nearest 5KB): 1.35GB
- Cost: 1.35 * $0.029 = $0.03915
- Kinesis Data Analytics:
- Cost: 1 KPU * $0.11 = $0.11
- CloudWatch (assuming the whole CloudWatch free tier has been consumed):
- Cost Dashboard: $3
- Cost custom metrics: 1 metric * $0.3 = $0.3
- Cost API Calls (push custom metrics + dashboard display) ~ to 1000 calls: 1 * $0.01 = $0.01
- Amazon S3 (Assuming data will stay on S3 for one month):
- Cost storage: ~ 1.4 GB * $0.023 = $0.0323
- Cost API ~ to 1000 calls PUT and 1000 calls GET: 1 * $0.005 + 1 * $0.0004= $0.00504
- QuickSight (Assuming paying for one month):
- Cost author: $24
Total: < $30
Although the cost can't simply multiply when you scale your application - decreasing price mechanism notably apply to several services and the QuickSight fees would be mostly the same until you require more capacities - it is interesting to look at specific parts of this architecture and estimate what would be the cost with the presented technology and some alternatives.
Example: What would be the cost of the ingestion layer for 800.000 bid requests / seconds for 1 hour?
Architecture alternatives to Kinesis Data Firehose for data ingestion:
- Amazon Kinesis Data Stream: It is a massively scalable and durable real-time data streaming service. In the same fashion than Amazon Kinesis Data Firehose except that you must manage shards.
- Amazon DynamoDB: It is a fully managed and serverless key-value and document database that delivers single-digit millisecond performance at any scale. We could use its API to push records directly into the database and later on using it.
- Amazon MSK: it is a fully managed Apache Kafka service that makes it easy for you to build and run applications to process streaming data.
- Total record size (each record rounded to nearest 5KB): 800000 * 60 * 60 * 5KB = 14.4 TB (14400 GB)
- Cost: $0.029 * 14400 = $417.6
- "One shard provides ingest capacity of 1MB/sec or 1000 records/sec"
- "A PUT Payload Unit is counted in 25KB payload “chunks” that comprise a record"
- Each record is 0.5 KB, so 1000 records represents 0.5 MB. One shard will handle 1000 records/sec
- Each record represents 1 PUT Payload Unit
- At 800000 records/ses:
- 800 shards are necessary
- it represents 2,880,000,000 PUT Payload Unit
- Cost: 800 shards * $0.015 + 2,880 PUT payload units * $0.014 = $52,32
- "For items up to 1 KB in size, one WCU can perform one standard write request per second."
- 800000 WCU are necessary to write records in the table
- Cost write: 800000/s over one hour * $0.00065/hour = $520 (Doesn't include reading cost)
- Cost storage: 800000 * 60 * 60 * 0.5 KB = 1440 GB * $0.25 = $360
- Assuming a broker instance
kafka.m5.24xlargecan handle 200000 requests / sec - Broker cost: 4 * $10.08 = $40.32
- Broker Storage Cost: 800000 * 60 * 60 * 0.5 KB = 1440 GB * $0.1 = $140
In that example, Amazon Kinesis Data Stream is the winner. In that case, contrary to Kinesis Firehose, it would be necessary to manage the scaling (in and out) of the Kinesis Data Stream: 800 shards won't always be necessary.
At a larger scale, some optimization and best practices will be necessary. Other alternatives might be tested (such as EC2 fleet behind a load balancer):
- Records grouping to reduce the number of records to ingest
- Geo distribution of ingestion layer to reduce latency
- Enhancement of Elasticity
To learn more about real-time bidding on AWS, read the whitepaper.
Since this CDK project is typescript based, sources need to be compiled to JavaScript every time you make a modification to source files. This project is configured with a nice little npm script called watch that automatically compile .js file every time you make a change
In the home directory, open a new terminal and enter:
$> npm run watchnpm run buildcompile typescript to jsnpm run watchwatch for changes as you edit the application and compilecdk deploydeploy this stack to your default AWS account/regioncdk diffcompare deployed stack with current statecdk synthemits the synthesized CloudFormation templatecdk destroydestroy the CDK application in your default AWS account/region
Note: a cdk diff command might take up several seconds. The main reason here is that the CDK command performs a hash of a very big file (train.txt) that we are uploading as an asset of the application.
Delete data of the Raw Data Bucket (output rawBucket of the stack) and destroy the CDK application:
$> aws s3 rm s3://dataexperimentstack-bidrequestexperimentstoragecc-XXXXXXXXXXXXX --recursive
$> cdk destroy- Producer:
- Data
- Pushing csv to Kinesis firehose
- Uploading data to s3 leveraging the Amazon S3 assets type
- Creating an AWS Fargate Service Using the AWS CDK
- aws-ecs-patterns CDK module
- fargate-service-with-logging
- Building docker image with CDK
- ecs-demo Dockerfile
- Deploy Go Applications to ECS using AWS CDK and its repository
- Ingestion:
- Enhancement:
- Creating a kinesis data analytics application with CDK + supportive CloudFormation documentation
- Uploading reference file to S3
- Send results to S3
- Enhance data
- Connect a lambda function to publish metrics to lambda start here and here
- Visualization:
- Create an Analysis using Your own Amazon S3 Data
- Create a graph in Amazon CloudWatch the idea is to provide number of clicked and not clicked ads per minute