This project is a docker based stack of tools to provide external reporting of Loxone infrastructure.
- Grafana (for visualization)
- grafana-clock-panel
- briangann-gauge-panel
- natel-plotly-panel
- grafana-simple-json-datasource
- natel-discrete-panel
- grafana-piechart-panel
- NodeRed (for data transfer)
- node-red-contrib-loxone
- node-red-contrib-influxdb
- InfluxDB (as database)
- unifi-poller (to get information of Ubiquiti Unifi Networks)
- telegraf-snmp (to get SNMP Information from Synology NAS and other devices)
- cadvisor (to monitor Docker envionment)
Start run.sh to setup the docker containers and create influx databases. Grafana will be availiable at port 3000 and NodeRed at 1880.
$ /bin/bash run.sh
After the first launch, all containers will start automatically at system startup.
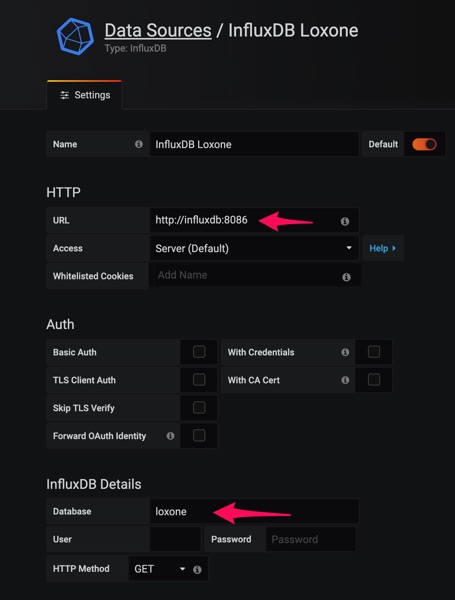
Setup the Datasource in Grafana for Influx DB:
URL: http://influxdb:8086
Setup InfluxDB connection in Node Red:

Change preferences in unifi-poller/up.conf to connect to your Unifi Controller. For further information see Unifi Poller
Setup your Synology IP Address in telegraf-snmp/telegraf.config
Grafana: http://127.0.0.1:3000 (User/PW admin/admin)
NodeRed: http://127.0.0.1:1880
- Docker
- Docker-compose
- Loxone