This python library provide functionality related to computing and plotting coverage, specificity and information granulas. For more details, please refer to the book:
Yao, Jingtao & Vasilakos, Athanasios & Pedrycz, Witold. (2013). Granular Computing: Perspectives and Challenges. IEEE transactions on cybernetics. 43. 10.1109/TSMCC.2012.2236648. - Download
Disclaimer: This library is not tested on Windows. If you are using Windows, then it's recommended to install Linux Subsystem to make it easier to run this project.
In order to use this library locally, you will need the following set up.
- Pro tip: You can setup a virtual environment to install the library dependencies. Follow this guide to set up a virtual environment.
After you're done with the above environment set up, please proceed to dependency installation step below.
Keep in mind that if you set up a virtual environment in the way described above, the virtual environment will be scoped to the current terminal session. This means that every time you open a new terminal for this project, you will need to activate the virtual environment for the current terminal session.
Create a new project and install the library. Run the following commands one at a time.
$ mkdir pygranulas-example
$ cd pygranulas-examplepygranulas-example:~$ python3 -m venv path_to_venv
pygranulas-example:~$ virtualenv venv && source path_to_venv/bin/activate
pygranulas-example:~$ pip3 install coverage-specificityQuickly test the library in a python interactive shell. Run the command below to start the shell.
pygranulas-example:~$ ipythonNext, copy and run the snippets below in the interactive shell.
- Create dataset or import an existing one
from sklearn.datasets import make_blobs
from sklearn.cluster import KMeans

X, y = make_blobs(n_samples=1000, centers=3,n_features=2,random_state=0,cluster_std=0.4)- Import library
from coverage_specificity import CoverageSpecificity- Initialize Coverage specificity Object
cs = CoverageSpecificity(X)- For a given dataset draw optimal number of clusters according to several validity indexes
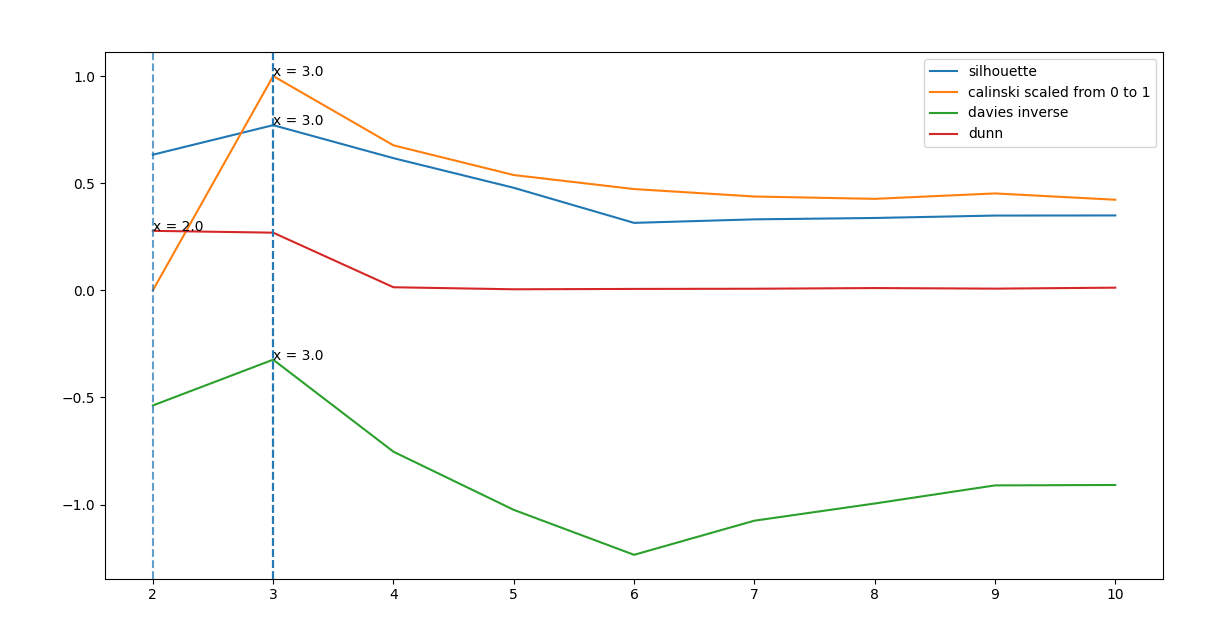
max_points = cs.draw_valid()Figure 1: Cluster validity indexes for two-dimensional synthetic data using k-means
kmean = KMeans(n_clusters=3)
kmean = kmean.fit(X)
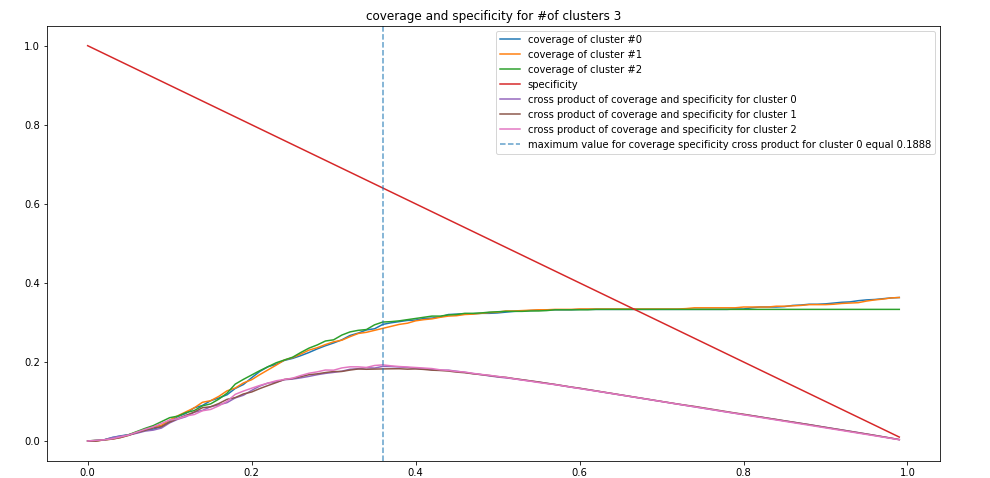
rs, cv_sp_dict =cs.cov_sp(kmean.cluster_centers_, 3)Figure 2: Specificity and coverage for k-means clusters
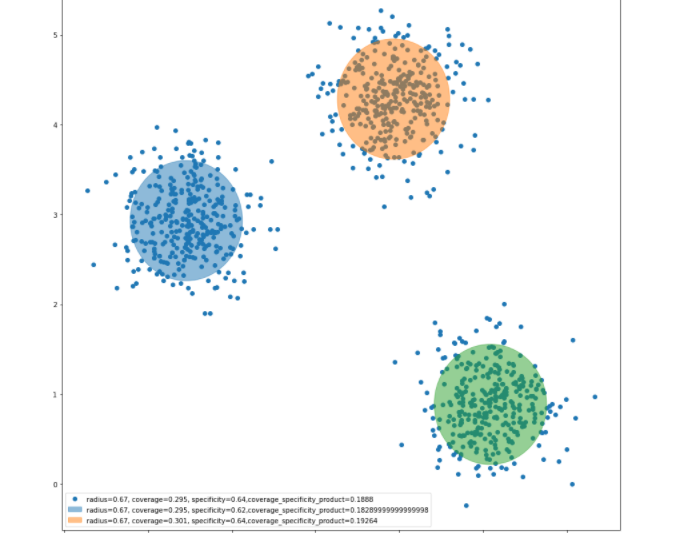
cs.granulas(kmean.cluster_centers_, rs, cv_sp_dict)Figure 3: Information granules around the clusters produced by clustering method (k-means in this case)
To validate the number of clusters produced by the clustering method (e.g k-means clustering), we apply four different validity indices; Dunn Index, Silhouette Index, Calinski-Harabasz Index, and Davies-Bouldin Index. The validity index provides a quality measurement for a suitable number of clusters for a sample of data. It tells us the quality of clusters but also the right number of clusters that produce that best quality. We thus compare and contrast the results from applying the four validity indices using k-means clustering. Each validity index provides a different approach and frame of reference to the quality of measure. All the four validity indices use the inter-cluster and intra-cluster relationship to find the optimal c.
The inter-cluster relationship shows the distance between data points within a cluster with the cluster centre while the intra-class cluster shows the distance between the data point of one cluster with the other data points in another cluster. The result obtained for k-means clustering of the example dataset is shown in Figure 1.
Next, we proceed with the construction of information granules with the use of the principle of justifiable granularity. The coverage and specificity is shown in Figure 2 above. The granules are formed around the prototypes produced by the clustering method (e.g k-means, fuzzy-c means, hierarchical clustering) as shown above in Figure 3.
To contribute, fork the repository, set up your environment, create an issue with describing the changes you want to make, make changes, send us a pull request referencing that issue. We will review your changes and apply them to the main branch:
This project's license is TBD.