JavaFX Utilities - Zoom and Pan Charts and Pane Scaling for JDK 7+ (including JDK 8)
License: Apache 2
Latest Release: 1.0
Development version: No work past 1.0 done yet.
- Add zooming functionality to a JavaFX XYChart:
- Drag mouse in plot area to zoom both axes, or on X or Y axis to zoom that axis only.
- (1.0) #5 Configurable via an AxisConstraintStrategy implementation.
- Mouse filter, for example allow only left click drag to zoom
- Animated zooming
- Mouse wheel zoom in plot area, X axis, or Y axis. This has NOT been tested with mice with "continuous" wheels, only ones that rotate in discrete steps/clicks.
- (1.0) #9 Allow reset to auto-zoom on double click
- Drag mouse in plot area to zoom both axes, or on X or Y axis to zoom that axis only.
- (Panning ability for XYCharts
- StableTicksAxis provides the same tick locations for a zoom level, regardless of the lower and upper bounds. This provides a much smoother experience when panning and zooming.
- (1.0) Ability to customize axis label formatting of StableTicksAxis
- Ability to create a Pane that scales when it resizes instead of reflowing its layout, creating an effect like a presentation slide.
- (1.0) #10 TabUtil to create tabs that can do drag and drop between TabPanes.
- An experimental way to replace a Node in the scene graph with a different one (it's not as easy as you think)
- A way to get X and Y offsets of a Node from an arbitrary ancestor in a way that handles translation/padding/layout, etc., but does not yet handle scale and rotations (this might be possible if transforms can be combined as rumored for JFX 8)
- By Daniel Weil: if the data range is very small, StableTicksAxis does not work well. So, if the range is less than 1e-300, range the axis as if min==max (which will show a straight line).
Starting with jfxutils 0.3.1, all releases are available in the Maven Central Repository. All builds also have javadoc and source variants available. The 0.3.1 release is the same as 0.3, except the POMs have been updated for deployment to the Central Repository.
<dependency>
  <groupId>org.gillius</groupId>
  <artifactId>jfxutils</artifactId>
  <version>1.0</version>
</dependency>Currently there is no development snapshot version, since no development has occurred since 1.0. However, settings when there is a snapshot are configured as below:
<repositories>
  <repository>
    <id>ossrh</id>
    <name>OSSRH Snapshots</name>
    <url>https://oss.sonatype.org/content/repositories/snapshots/</url>
  </repository>
</repositories>
Then you can add dependency on the snapshot:
<dependency>
  <groupId>org.gillius</groupId>
  <artifactId>jfxutils</artifactId>
  <version>1.0-SNAPSHOT</version>
</dependency>jfxutils 0.3 and earlier were never published at Maven Central Repository and only at the gillius.org repository. Note for 0.3, I made a release 0.3.1 with the same code that is published at Maven Central.
<repositories>
  <repository>
    <id>gillius-org</id>
    <name>Gillius.org Maven Repository</name>
    <url>https://www.gillius.org/maven2</url>
  </repository>
</repositories>
Then add the following to your dependencies section:
<dependency>
  <groupId>org.gillius</groupId>
  <artifactId>jfxutils</artifactId>
  <version>0.3</version>
</dependency>- Documentation for 1.0: https://gillius.org/jfxutils/docs/latest/
- Documentation for 0.3/0.3.1: https://gillius.org/jfxutils/docs/0.3/
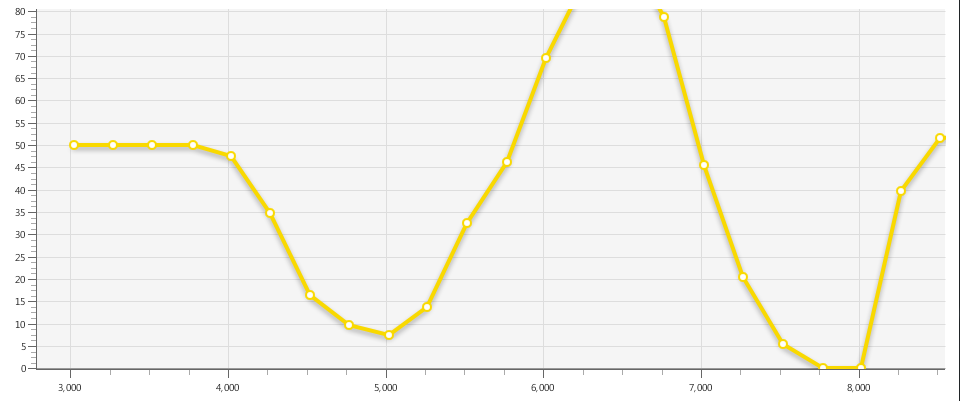
Here is a screenshot showing the example application in the jfxutils-example artifact. The first image shows the example using the new StableTicksAxis, which has better performance than the JavaFX NumberAxis when zooming and panning as the tick marks are fixed relative to the data values:
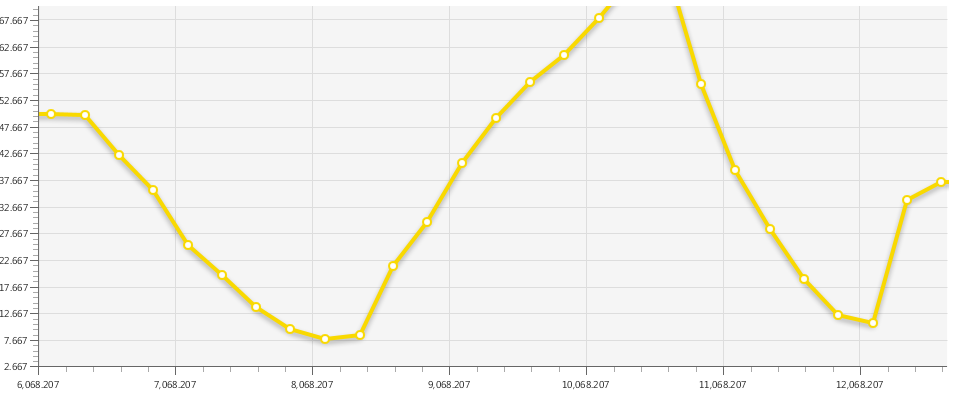
Here is the charting application using the NumberAxis after zooming and panning, showing the awkward tick labels that result, as NumberAxis tick labels are fixed with the graph's graphical layout and not fixed relative to the data:
Since JavaFX is not included in the default classpath of JDK 7 applications, even if you have installed JavaFX SDK or are using a recent Java 7 with it bundled, compiling is awkward. When you compile if you get reference errors to javafx packages, copy the jfxrt.jar from your JDK's jre/lib directory to jre/lib/ext. This solution was proposed at https://github.com/zonski/javafx-maven-plugin/wiki/Fixing-the-JRE-classpath. You can also run the Maven command on that page to do the copy for you, but you must run as a user with permissions to copy files in the JDK (i.e. run as admin). Once this is done you can use Maven to build the library. Using the library as a dependency does not require this particular solution, as long as your own project is already building fine with JavaFX.

