![]()
Gantt charts in Python
Clone this repository, navigate inside and run
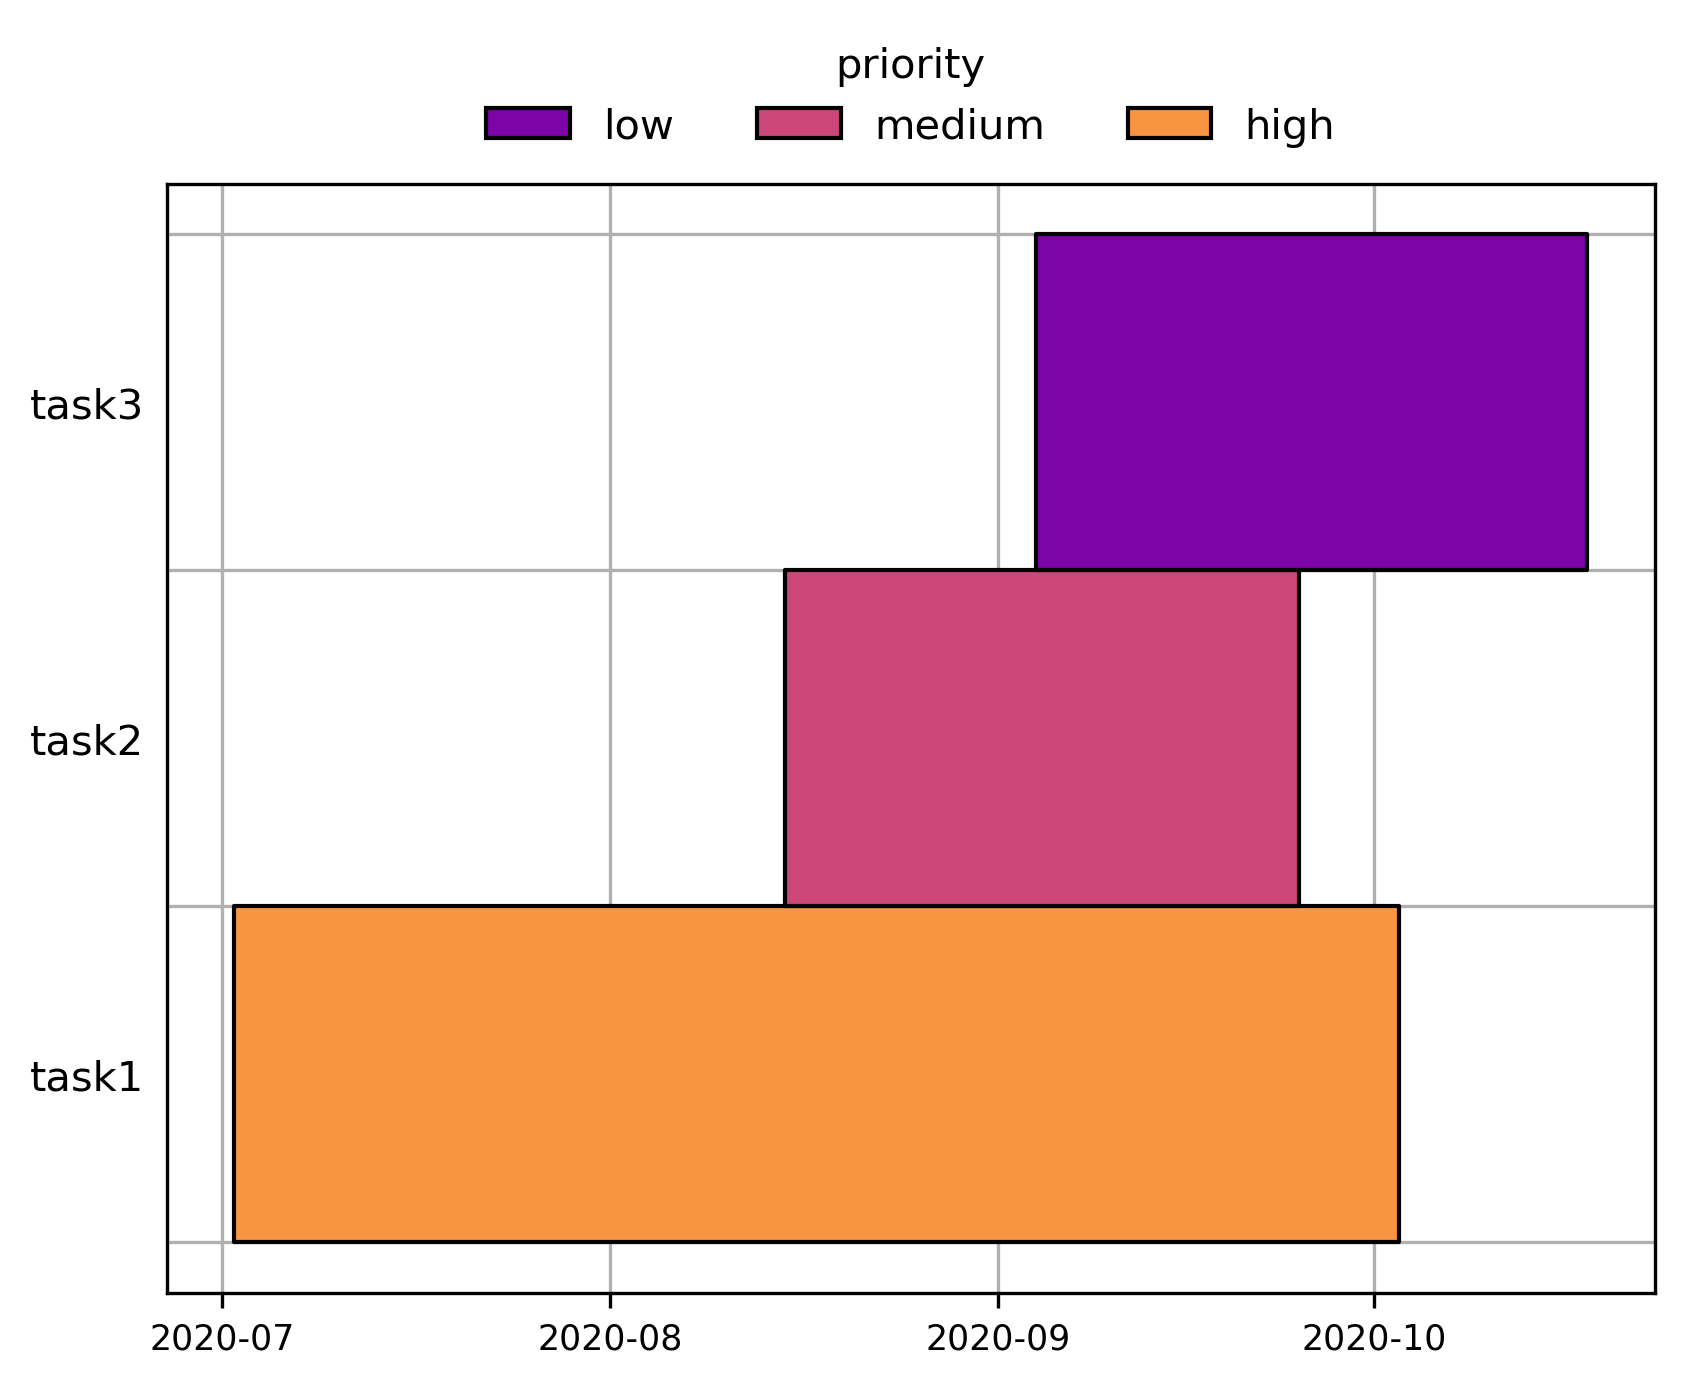
pip install -e .ganttly is built off collections of Tasks. A Task is simply a unit with a name, start date, and end date. It can also be annotated with tags (such as assignee, priority, etc.).
from pandas import Timestamp
from ganttly import Task

task1 = Task(
    name="task1",
    start=Timestamp("2020/07/02"),
    end=Timestamp("2020/10/03"),
    priority="high",  # optional tags as kwargs
    assignee="David"
)
task2 = Task(
    name="task2",
    start=Timestamp("2020/08/15"),
    end=Timestamp("2020/09/25"),
    priority="medium",
    assignee="Rachel"
)
task3 = Task(
    name="task3",
    start=Timestamp("2020/09/04"),
    end=Timestamp("2020/10/18"),
    priority="low",
    assignee="Sam"
)
Tasks are added to a Gantt object which organizes the tasks for plotting. Plotting a Gantt chart requires specifying the scale of the time axis (days, months, etc.). This can be done by specifying either the interval + frequency or with a custom RRuleLocator. Plots can be colored by a given tag and a color palette.
import seaborn as sns
from ganttly import Gantt

g = Gantt()
g.add_tasks([task1, task2, task3])

palette = dict(zip(["low", "medium", "high"], sns.color_palette("plasma", 3)))
g.plot(
    frequency="month",
    interval=1,
    color_tag="priority",
    palette=palette
)