The Tableau Data Analysis project "Detailed Analysis of Amazon Sales in India" is focused on providing an in-depth analysis of Amazon sales in India. The project explores various dimensions of Amazon sales data, including product categories, sales volume, and customer demographics.
The project involves creating interactive dashboards and visualizations using Tableau, a popular data visualization tool. The dashboards allow users to explore the data and gain insights into the patterns and trends in Amazon sales in India.
The analysis highlights several key findings, including the top-selling product categories in India, the geographic distribution of sales, and the most popular payment methods. The project also examines customer demographics, such as age, gender, and location, to identify patterns in consumer behavior.
One of the main benefits of this project is that it provides valuable insights into Amazon's sales performance in India, which can be used to inform business strategies and marketing campaigns. The project also demonstrates the power of data visualization and analysis tools like Tableau for exploring complex datasets and extracting meaningful insights.
Overall, the Detailed Analysis of Amazon Sales in India project is a valuable resource for anyone interested in understanding the dynamics of e-commerce sales in India and the factors that drive consumer behavior in this market.
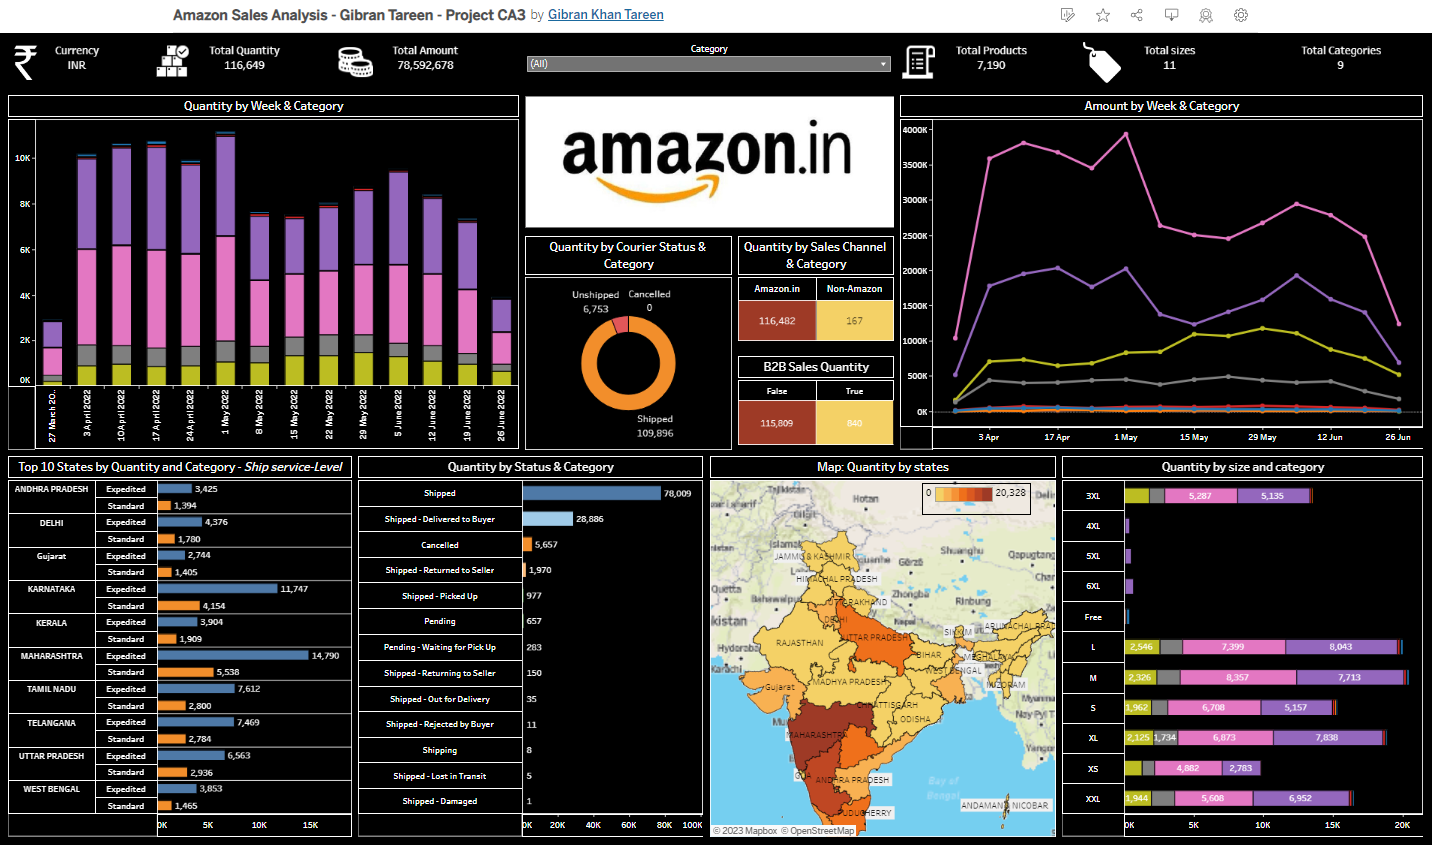 My Dashboard for the Project
You can see my Dashboard live on the link below: https://tinyurl.com/gibran-tableau-project-ca3
If you have any feedback, please reach out to me at gibrankhantareen@gmail.com