In this Tableau Data Analysis project, I have done an indepth analysis of AirBNB in New York City to provide deep insights of various aspects of AirBNB bookings in New York City. The project explores several dimensions of the AirBNB data such as prices per room, the most popular neighbourhoods for bookings, and other important information.
The project includes visualizations of the data through interactive dashboards and charts created using Tableau. The dashboards allow users to explore the data from different angles and filter the data based on various criteria such as price range, neighborhood, and room type.
One of the main findings of the analysis is that the average price per room varies significantly across neighbourhoods in New York City, with some neighbourhoods being much more expensive than others. The analysis also highlights the most popular neighbourhoods for bookings, such as Manhattan, Brooklyn, and Queens, and the most common room types, such as private rooms and entire apartments.
Overall, the project provides a comprehensive overview of the AirBNB data in New York City and can be useful for anyone interested in understanding the booking patterns and pricing trends in the city's short-term rental market.
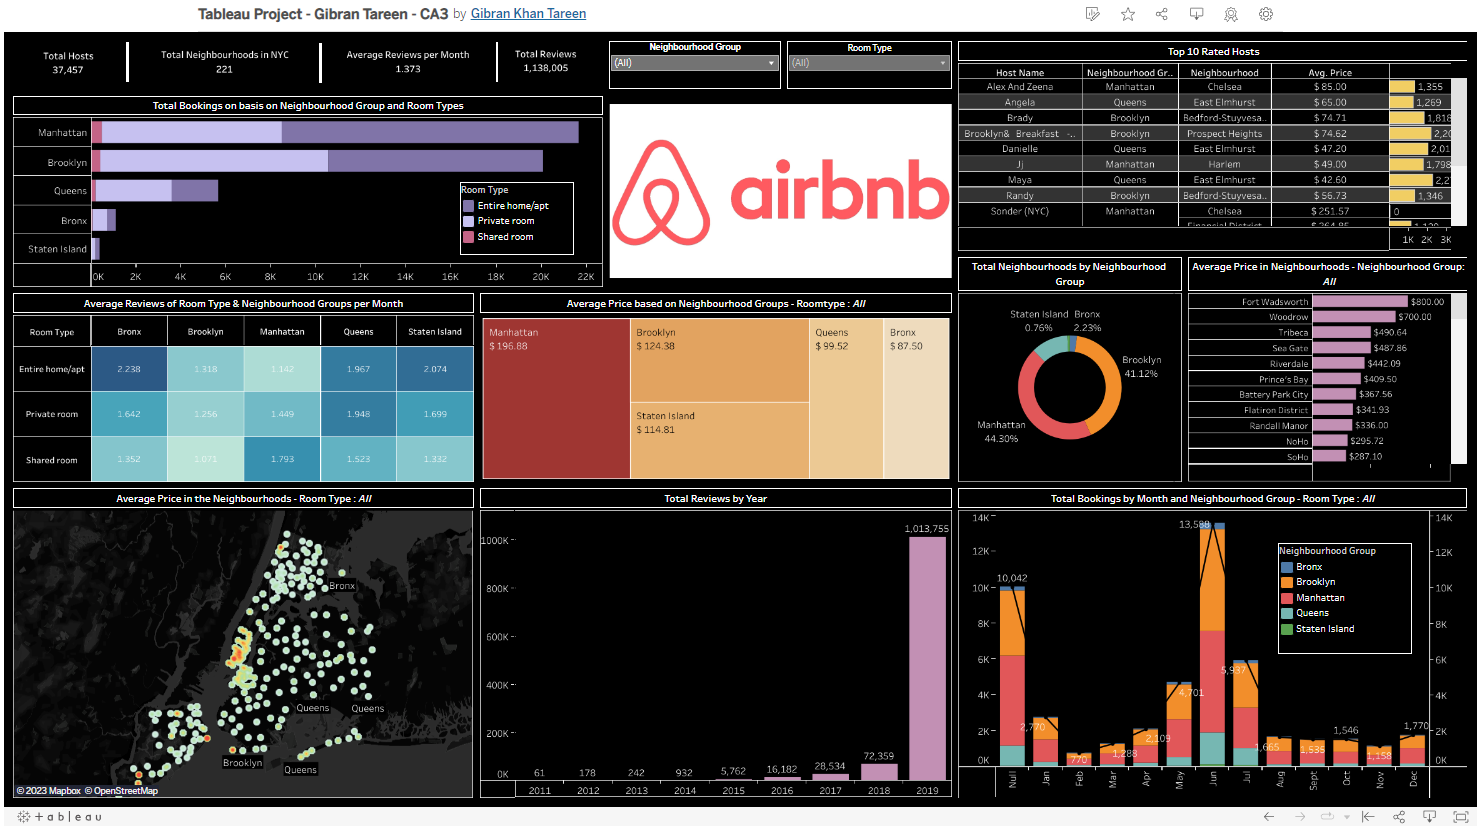 My Dashboard for the Project
You can see my Dashboard live on the link below: https://tinyurl.com/gibran-tableau-ca3
If you have any feedback, please reach out to me at gibrankhantareen@gmail.com