This console based application takes in score sheets in from University of Washington's introductory CSE 142 and CSE 143 courses posted by Stuart Reges. The application can either take one score sheet in and perform analysis on that quarter in particular, or take in two consecutive quarters of 142 and 143 and calculate and graph the correlation between grades in 142 and 143.
Note that all the raw data gradesheet files are already included in the CSRawData directory. This project will be constantly updated as Reges posts more gradesheets.
The application has three core features:
- Parse: Parses the raw data spreadsheet and prints it out into a JSON file. In parsing a single file, each student's midterm, final, overall homework score, and final grade are stored into a JSONObject which is then outputted. If two files are selected, both the student's 142 and 143 midterm, final, homework percentage, and final grades are printed out to allow for comparision.
Here is an example of a single parsed course (Stuart's most recent 143 class).
Here is an example of two parsed courses which contain data on students who took Autumn 2013 CSE 142 and Winter CSE 143 and their corresponding grades.
- Correlate: Calculates the Pearson coefficent between various fields and a student's final grade. In correlating a single grade sheet, a student's midterm, homework, and final scores are correlated with their final grade. Each of these fields are then printed out to both the console and to a text file. For correlating two grade sheets from consecutive quarters, a student's respective categories, their midterm from 142 and 143, their homework % from 142 snd 143, and their final and final grades from 142 and 143 are all correlated.
Here is an example of a single quarter with students' scores (midterm, homework, final) correlated with their final grade.
Here is an example of two consecutive courses with their scores for 142 and 143 for their midterm, homework, final, and final grades all correlated.
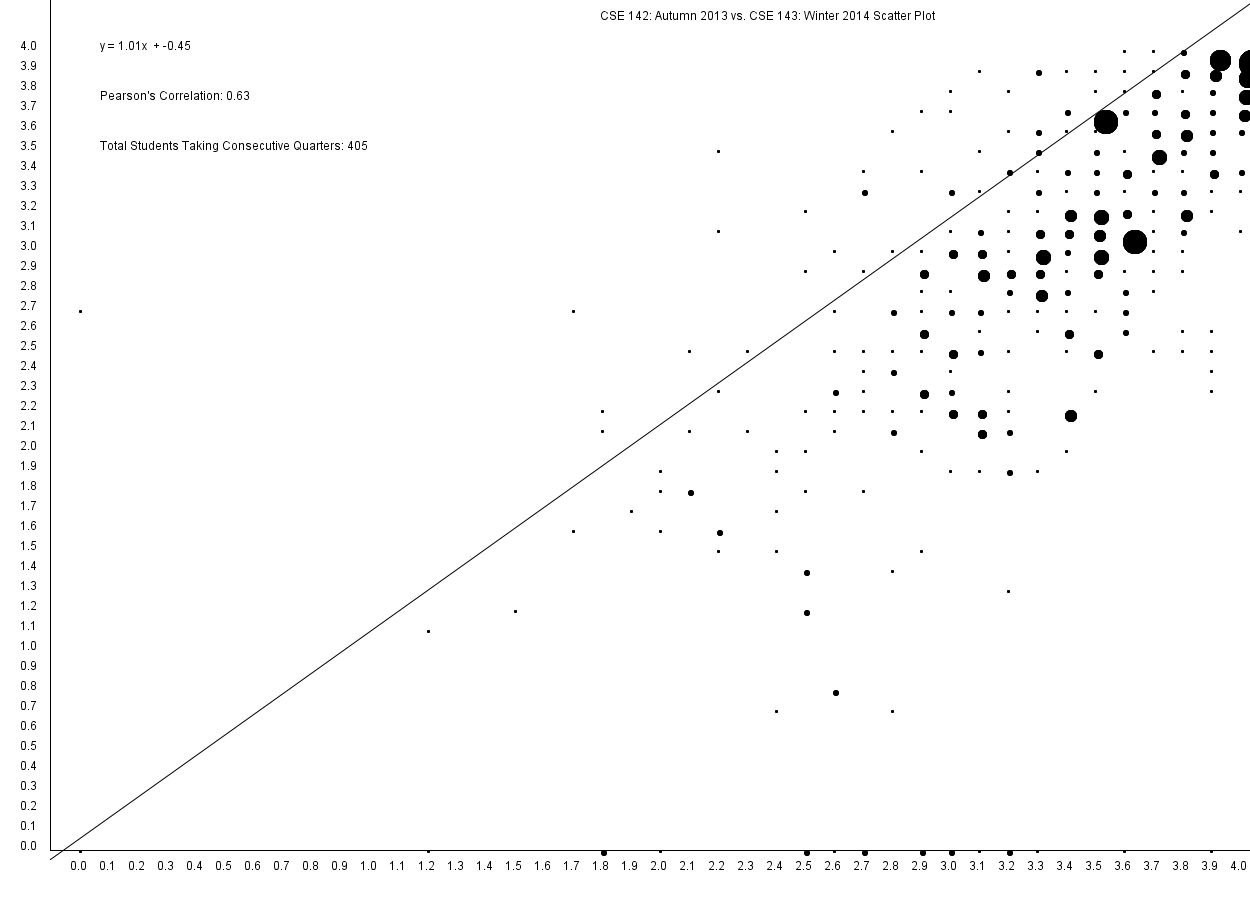
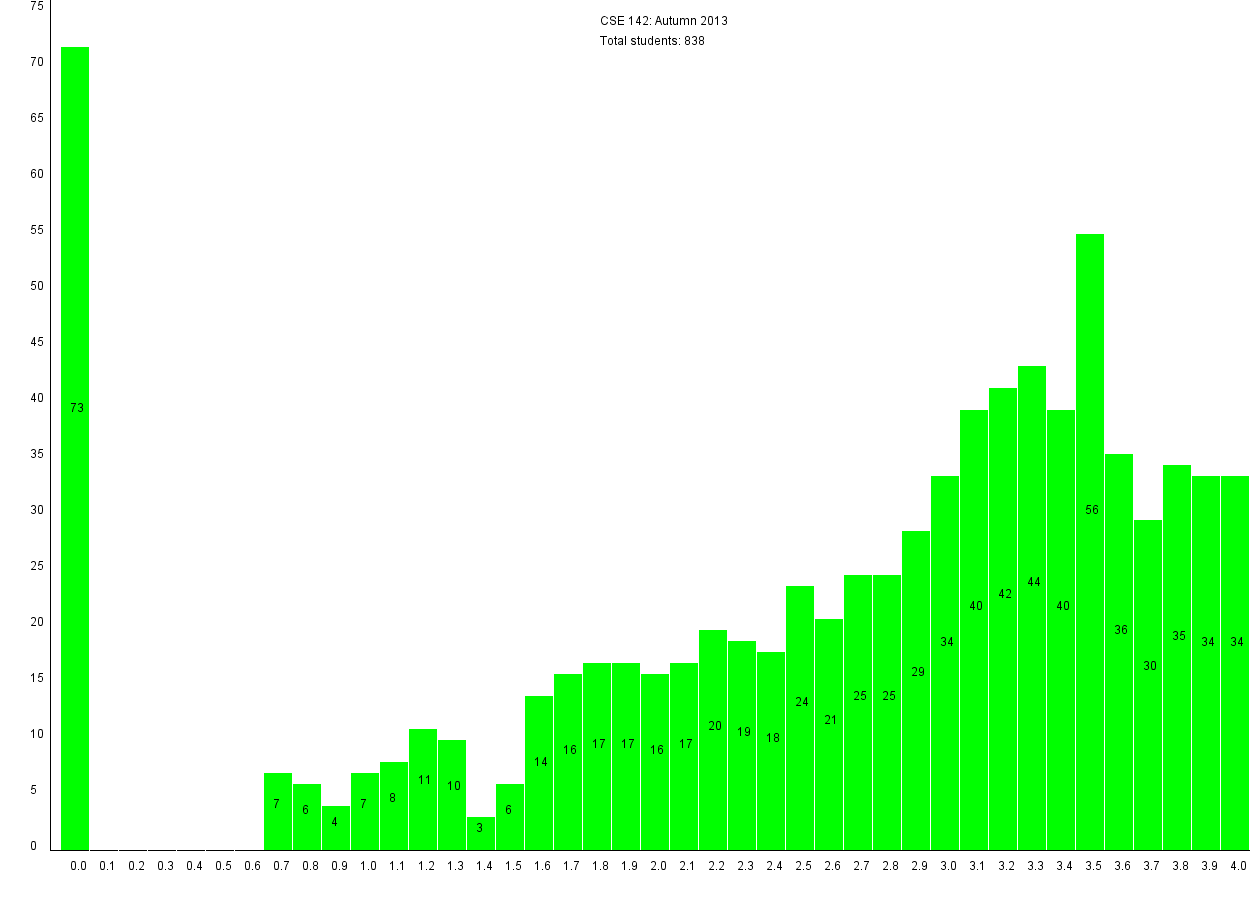
- Graph: Given a single quarter, the program will graph the grade distribution of each grade (0.0 to 4.0). For two quarters, the the program will graph a scatter plot of CSE 142 grades on the x axis and CSE 143 grades on the y axis and perform linear regression to generate a line of best fit along with calculating the Pearson coefficient that will appear on the graph.
Here is an example of a single quarter graph with the grade distribution of grades of CSE Autumn 2013.
Here is an example of a scatterplot created from two consecutive quarters and their data. Note that the darker circles represent more instances of that particular grade.