The QGate graph generates graphical outputs based on performance tests (QGate Perf). Key benefits:
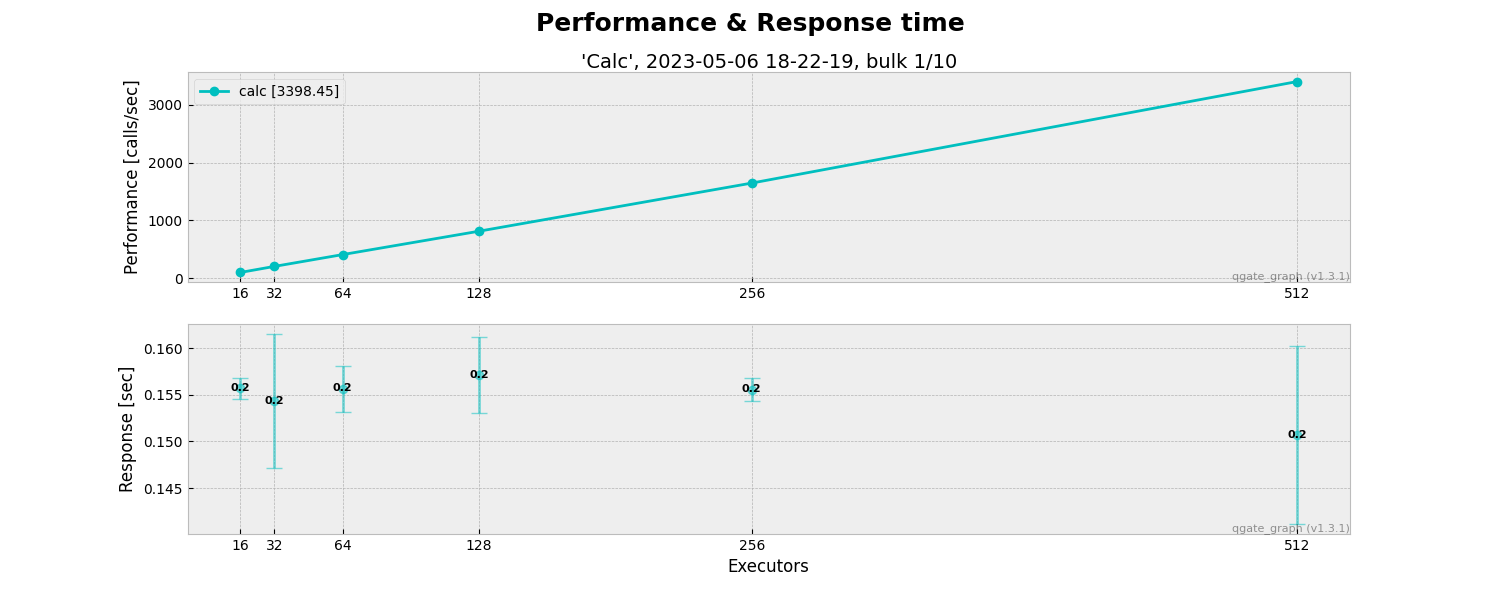
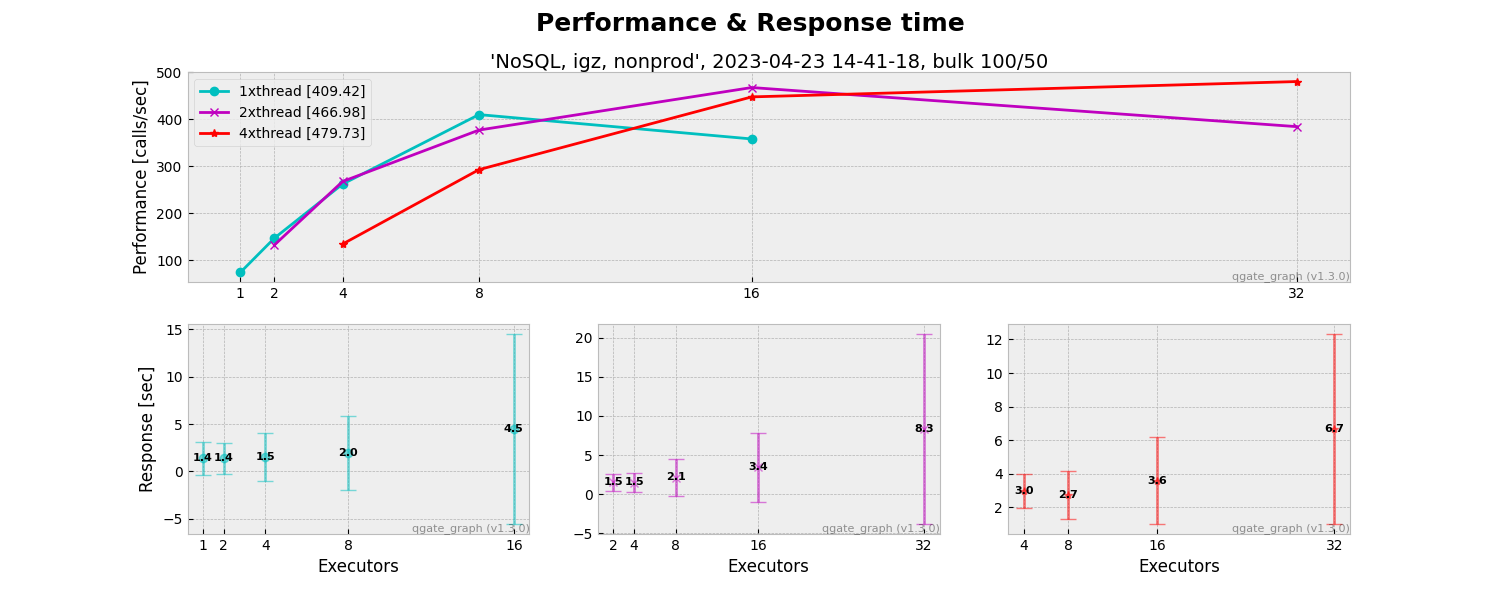
- provide graphs about Performance/Throughput and Response time (on typically client side)
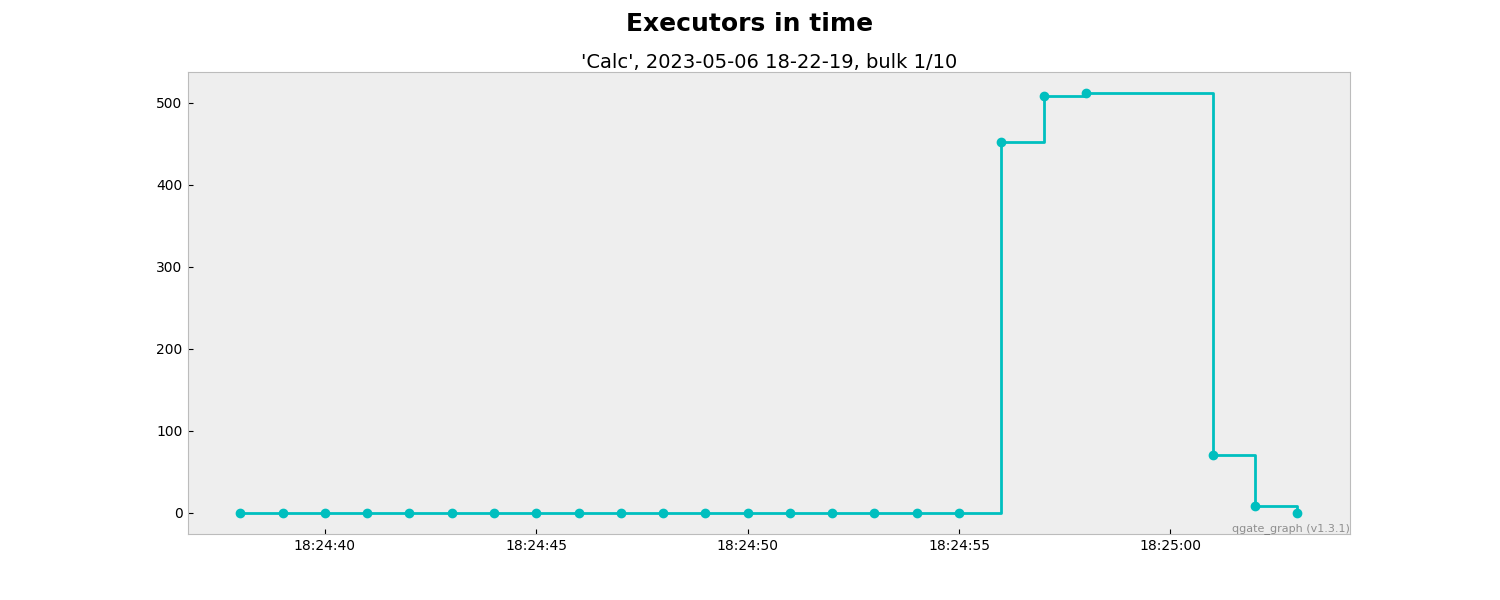
- provide graphs about Executors in time
These graphs only visualize outputs from performance tests, it is not replacement of detail views from Grafana, Prometheus, etc. in detail of CPU, GPU, RAM, I/O etc. on side of testing system.
    from qgate_graph.graph_performance import GraphPerformance
    from qgate_graph.graph_executor import GraphExecutor
    import logging

    # setup login level
    logging.basicConfig()
    logging.getLogger().setLevel(logging.INFO)

    # generate performance/throughput graphs
    graph=GraphPerformance()
    graph.generate_from_dir()

    # generate excutors in time graphs
    graph=GraphExecutor()
    graph.generate_from_dir()