DEPRECATED: This project is deprecated. Use Grafana-Zabbix instead.
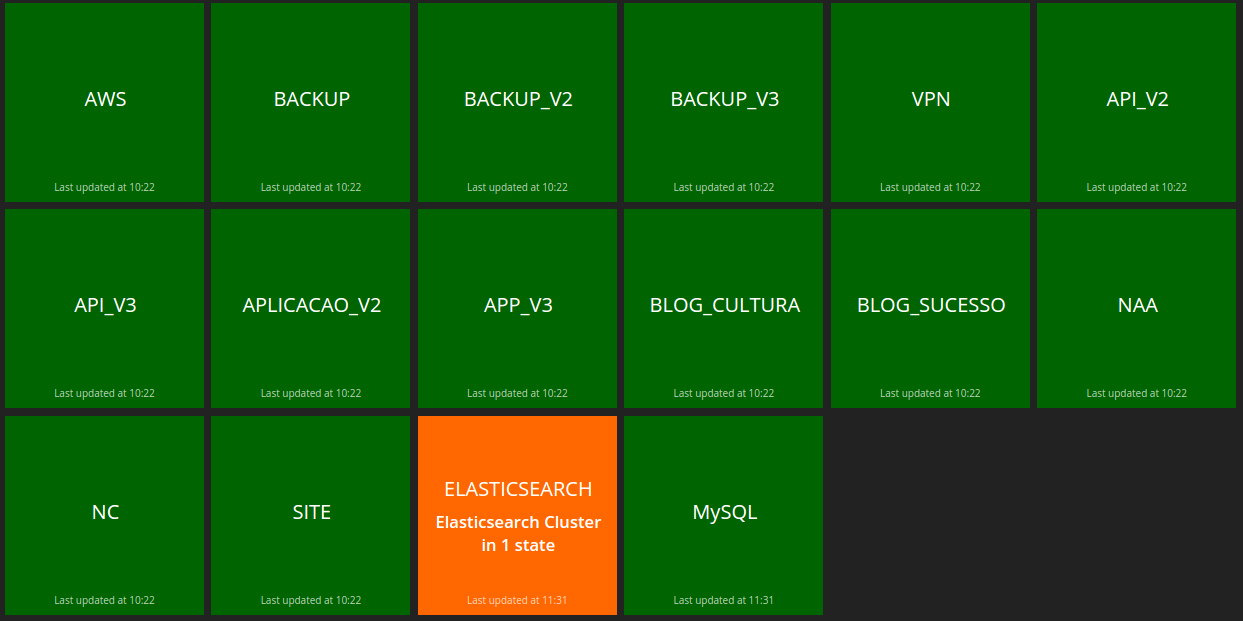
This is a dashboard created with dashing to show Zabbix triggers grouped by application, not by severity. It dinamically creates widgets based on templated applications and changes those colors based on fired triggers.
BEFORE install this software, you will need to organize all of your Zabbix triggers and items into templates and make sure that all templeted items / web scenarios are correctly associated to templeted applications.
For example, if you need to monitor two web applications (MyAPP1 and MyAPP2) using 2 distincts web scenarios, you must:
- Create a template for it (Template MyAPPs)
- Create the desired application names (MyAPP1 and MyAPP2) WITHOUT SPACES in the names. This is necessary because Zabbix Dashing will dinamically create widgets based on application names collected from Templates.
- Create all web scenarios needed and make the relation between them and the above applications.
- Create all the desired triggers.
- Associate the template to a host.
This is what Zabbix Dashing do each minute:
NOTE: trigger priority term is used to refer to trigger severity
- Get template ids from config file
- Generate a list of template ids
- Get application names from template ids
- Generate a list of application names
- For each application name:
- Get application id inherited from template that is equal to application name
- Get triggers with state problem where that are related to the application id
- Check if there are triggers
- If yes:
- For each trigger
- Get the greater trigger priority
- Check associated items
- Check if the associated items are disabled
- Get events from trigger with acknowledgedment = yes
- If there are acknowledgedment
- Send event to the application widget with ack (blue color)
- Else:
- Send event to the application widget without ack (one of the priorities colors, depending of the trigger severity)
- For each trigger
- If no:
- Send event to the application widget with status OK (green color)
- If yes:
- Set the array zabbix_widget_names with the application names that will be used for generate widgets
As you can see, for each application's trigger with status problem, the dashboard will elect the one with the greater priority. So, a disaster trigger will have priority over warning trigger. Then, if two triggers are fired up, Zabbix Dashing will change the color of the widget based on the collor of the trigger with the greater priority.
NOTE: This dashboard doesn't display Information severity.
OK: #0abf0d;
Warning: #b8b346;
Average: #ff6700;
High: #f04b4b;
Disaster: #ff0000;
Trigger acknowledged: #0000ff;Clone this reposity into /opt/
$ cd /opt
$ git clone https://github.com/galindro/zabbix-dashing
Execute install.sh script
$ cd /opt/zabbix-dashing
$ sudo ./install.shEdit the bellow file:
$ vim /etc/default/zabbix-dashing-init.conf# Must be a valid filename
# This is the name of dashing binary
NAME=dashing
# This is the location of zabbix-dashing
DASHING_DIR=/opt/zabbix-dashing
# Process PID File
PIDFILE="/var/run/$NAME.pid"
# This is the location of dashing binary
DAEMON=/usr/local/bin/$NAME
# This is the location of ruby gems
GEM_HOME=/var/lib/gems/1.9.1
# This is the port where the service will run
DASHING_PORT=8080
# Options for start-stop-daemon
DAEMON_OPTS="start -d -p $DASHING_PORT -P $PIDFILE --tag $NAME -D"
#User and group to run the service
RUNUSER=root
RUNGROUP=rootBy default, the user and password to access the dashboard is admin/admin. But you can change it in config.ru. There, you could configure your authentication token used by zabbix.rb job to put data into Zabbix Dashing dashboard.
$ vim /opt/zabbix-dashing/config.rurequire 'dashing'
configure do
#Auth Token
set :auth_token, 'YOUR-AUTH-TOKEN'
helpers do
def protected!
unless authorized?
response['WWW-Authenticate'] = %(Basic realm="Restricted Area")
throw(:halt, [401, "Not authorized\n"])
end
end
def authorized?
@auth ||= Rack::Auth::Basic::Request.new(request.env)
#HTTP Authentication
@auth.provided? && @auth.basic? && @auth.credentials && @auth.credentials == ['admin', 'admin']
end
end
end
map Sinatra::Application.assets_prefix do
run Sinatra::Application.sprockets
end
run Sinatra::ApplicationEdit the bellow file to configure the dashboard
$ vim /opt/zabbix-dashing/jobs/zabbix-monitor-config.json{
"Zabbix" : {
# Applications to include (optional). If it isn't informed, all aplications will be get from templates
"applications_include" : ["EMAIL","DOVECOT"],
# Applications to exclude (optional). If it isn't informed, all aplications will be considered
"applications_exclude" : [
"POSTFIX"
],
# Put here your template names
"templates" : [
"Template 1",
"Template 2",
"Template 3"
],
# Put here your Zabbix API connection parameters
"api_config" : {
"url" : "http://localhost/api_jsonrpc.php",
"user" : "admin",
"password" : "password"
}
},
# Put here your auth_token configured in /opt/zabbix-dashing/config.ru
"auth_token" : "YOUR-AUTH-TOKEN"
}Start the service with this command
$ /etc/init.d/zabbix-dashing startZabbix Dashing has 2 dashboards:
- zabbix-monitor - http://localhost:/zabbix-monitor
- zabbix-monitor-tv (optimized for 1080p resolution) - http://localhost:/zabbix-monitor-tv
This software was tested on this envirionment:
- Ubuntu 14.04
- Zabbix 2.4
- Ruby 1.9.1
GNU GENERAL PUBLIC LICENSE Version 2, June 1991