This project aims to answer a few specific questions regarding the NYC Taxi Trips Dataset with the objective of analysing the taxi's performances and improve it through logistic reorganization and service improvement.
This project is based on several DAGs (Directed Acyclic Graphs) that are executed on Apache Airflow, moreover I used Airflow to orchestrate all ETL processes and maintain their correct frequency along with a AWS Redshift database cluster that is nothing more than a PostgreSQL database optimized to distribute our data across several nodes within the cluster and process all our queries in a distributed fashion making it capable to process large amounts of data. The advantage of using the Redshift cluster is that it's easy/fast to spin up, compatible with several data consumers/ pipelines orchestrators (like Airflow), and has support to load JSON/CSV files right from a single short query.
Create (if not already created) your Redshift cluster. I provided a few scripts to help spining up a Redshift
cluster using the AWS API, directly from the command line. Before diving into them, make a copy of the dwh.cfg.example
as dwh.cfg and fill all the keys (except the HOST under CLUSTER section). Then you just need to:
- Start the cluster provisioning by running:
python aws/create_cluster.py
- Wait a few minutes and check if the cluster status is available by running:
python aws/check_cluster_available.py- You should run this script until the cluster is available. Because this script is responsible of updating our
dwh.cfgwith theHOSTaddress
- When the cluster is already available, your dwh.cfg would be rewrited with its
HOSTaddress. Then you just need to copy that configuration over to the Airflow Connections. There's a script to do that:python aws/register_airflow_connections.py
- (optional, after work) And for the sake of our AWS bills (keep'em low), there´s also a script to destroy the cluster:
python aws/destroy_cluster.py(but this one is for later)
After doing that, before activating the DAGs you have to configure the following Airflow connections. But before we need to get Airflow itself running:
We will use Docker to provision our local environment and to ease the production deployment process too (if required).
The Docker image we will use is the puckel/docker-airflow (docker pull puckel/docker-airflow)
Inside the root folder of this project run the following command:
docker run -d -p 8080:8080  \
    -v $(pwd)/dags:/usr/local/airflow/dags \
    -v $(pwd)/plugins:/usr/local/airflow/plugins \
    -v $(pwd)/requirements.txt:/requirements.txt \
puckel/docker-airflow webserverIf you hit on the wall with the python aws/register_airflow_connections.py below we have a table with a dictionary
of connections:
| Service | Conn ID | Conn Type | Other fields |
|---|---|---|---|
| Redshift | redshift |
Postgres |
This one you should figure out by yourself. (It's your database credentials!) |
| Amazon Web Services Credentials | aws_credentials |
Amazon Web Services |
On the login field you fill with your API Key. And in the password field you fill with your API Secret. |
This DAG is meant to be used only to reset the schema of the analytical tables. It is composed by only one task. That only task takes care of dropping the tables if needed and creating it again.
This one shall be run manually.
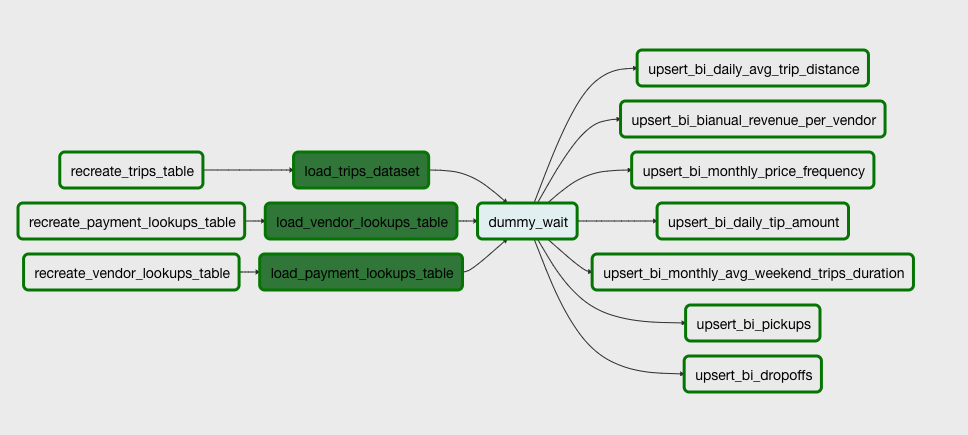
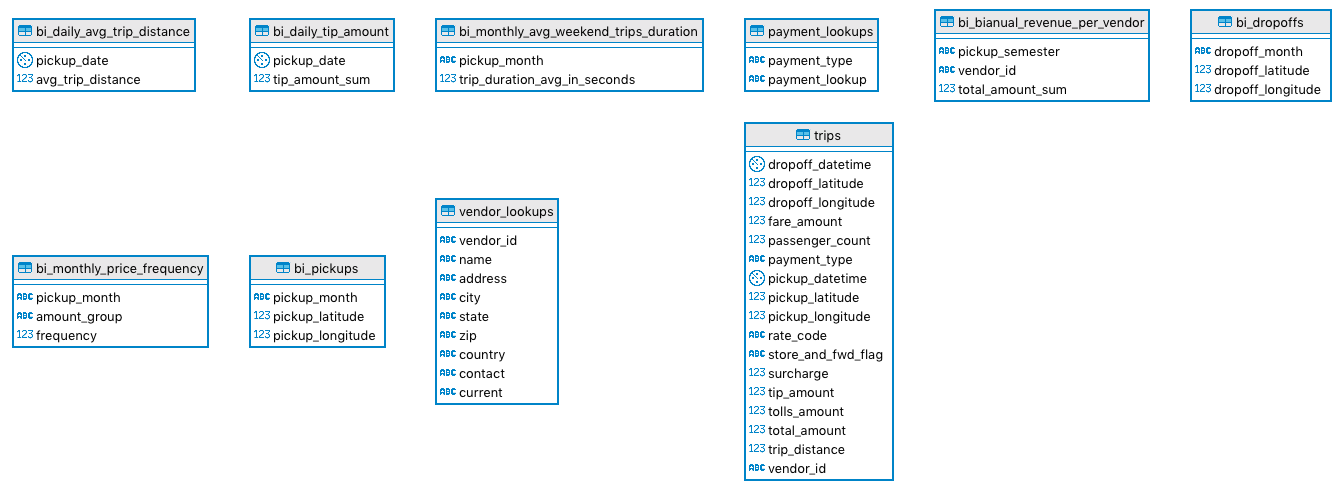
This DAG takes care of loading the CSV and the JSONs provided by the challenge. After loading it, it will run several
upsert queries that will populate the tables above. This means that if it's your first time running this project you
should run the recreate_bi_tables before running this one.
This DAG runs annually.
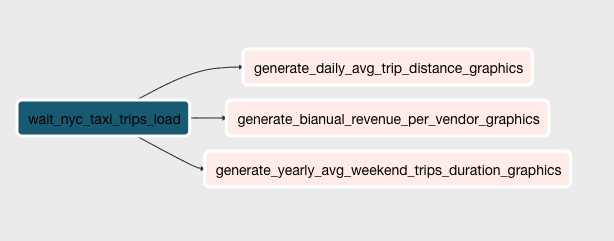
This DAG takes care of reading the analytical tables and generating visualization graphs that will give us insight about NYC mobility.
This DAG runs annually (as its names states). It only starts after the nyc_taxi_trips_load DAG finished running
for the current year of the current execution date.
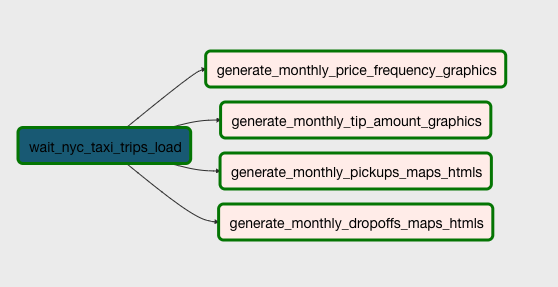
This DAG also takes care of reading the analytical tables and generating visualization graphs and maps that will give us even more detailed insights.
This DAG runs monthly. And it also only starts after the nyc_taxi_trips_load DAG finished running for the current
year of the current execution date.
Next steps for this project:
- Refactor the
awspython scripts that manage the infrastructure creation to be tasks within a DAG that auto spin up, run all the ETL process and then spin down the infrastructure - Improve the graphics visualization (fix buggy graphics that cut words in half on the legend)
- Fix the graphics visualization x labels that override each other (make them vertically aligned)
- Improve the maps loading times and its centralization towards the plotted points
- Create a rich web visualization using the generated graphics
- Implement a streaming data pipeline to monitor the datasets folder, stream it to Redshift and trigger the visualization generation DAGs