This repository is out of date. If you want to use this toolbox, we strongly advise you to use MNELAB, which includes all the feature.
The Time-Frequency toolbox GUI is a graphic user interface designed to interact with the MNE Library, by using its frequency and time-frequency analysis functions.

To install the dependencies required for this application, change the working directory to the repository and run the line pip install -r requirements.txt. You must have python3 installed.
To run the application simply run the line python run_app.py.
For now, the app can only treat the data to display the power spectrum density of raw eeg files, and epoched eeg files, with the formats .fif. If you want to treat another format, please save it as fif using a preprocessing toolbox before using this toolbox.
First import your file which can be either a raw file (format *.fif), or epoched data (format .epo-fif).
This toolbox does not perform any preprocessing in the file, so you have to preprocess the signal before using it in this toolbox, by removing and interpolating bad channels, applyings correct filters and applying a montage to display the topomaps.
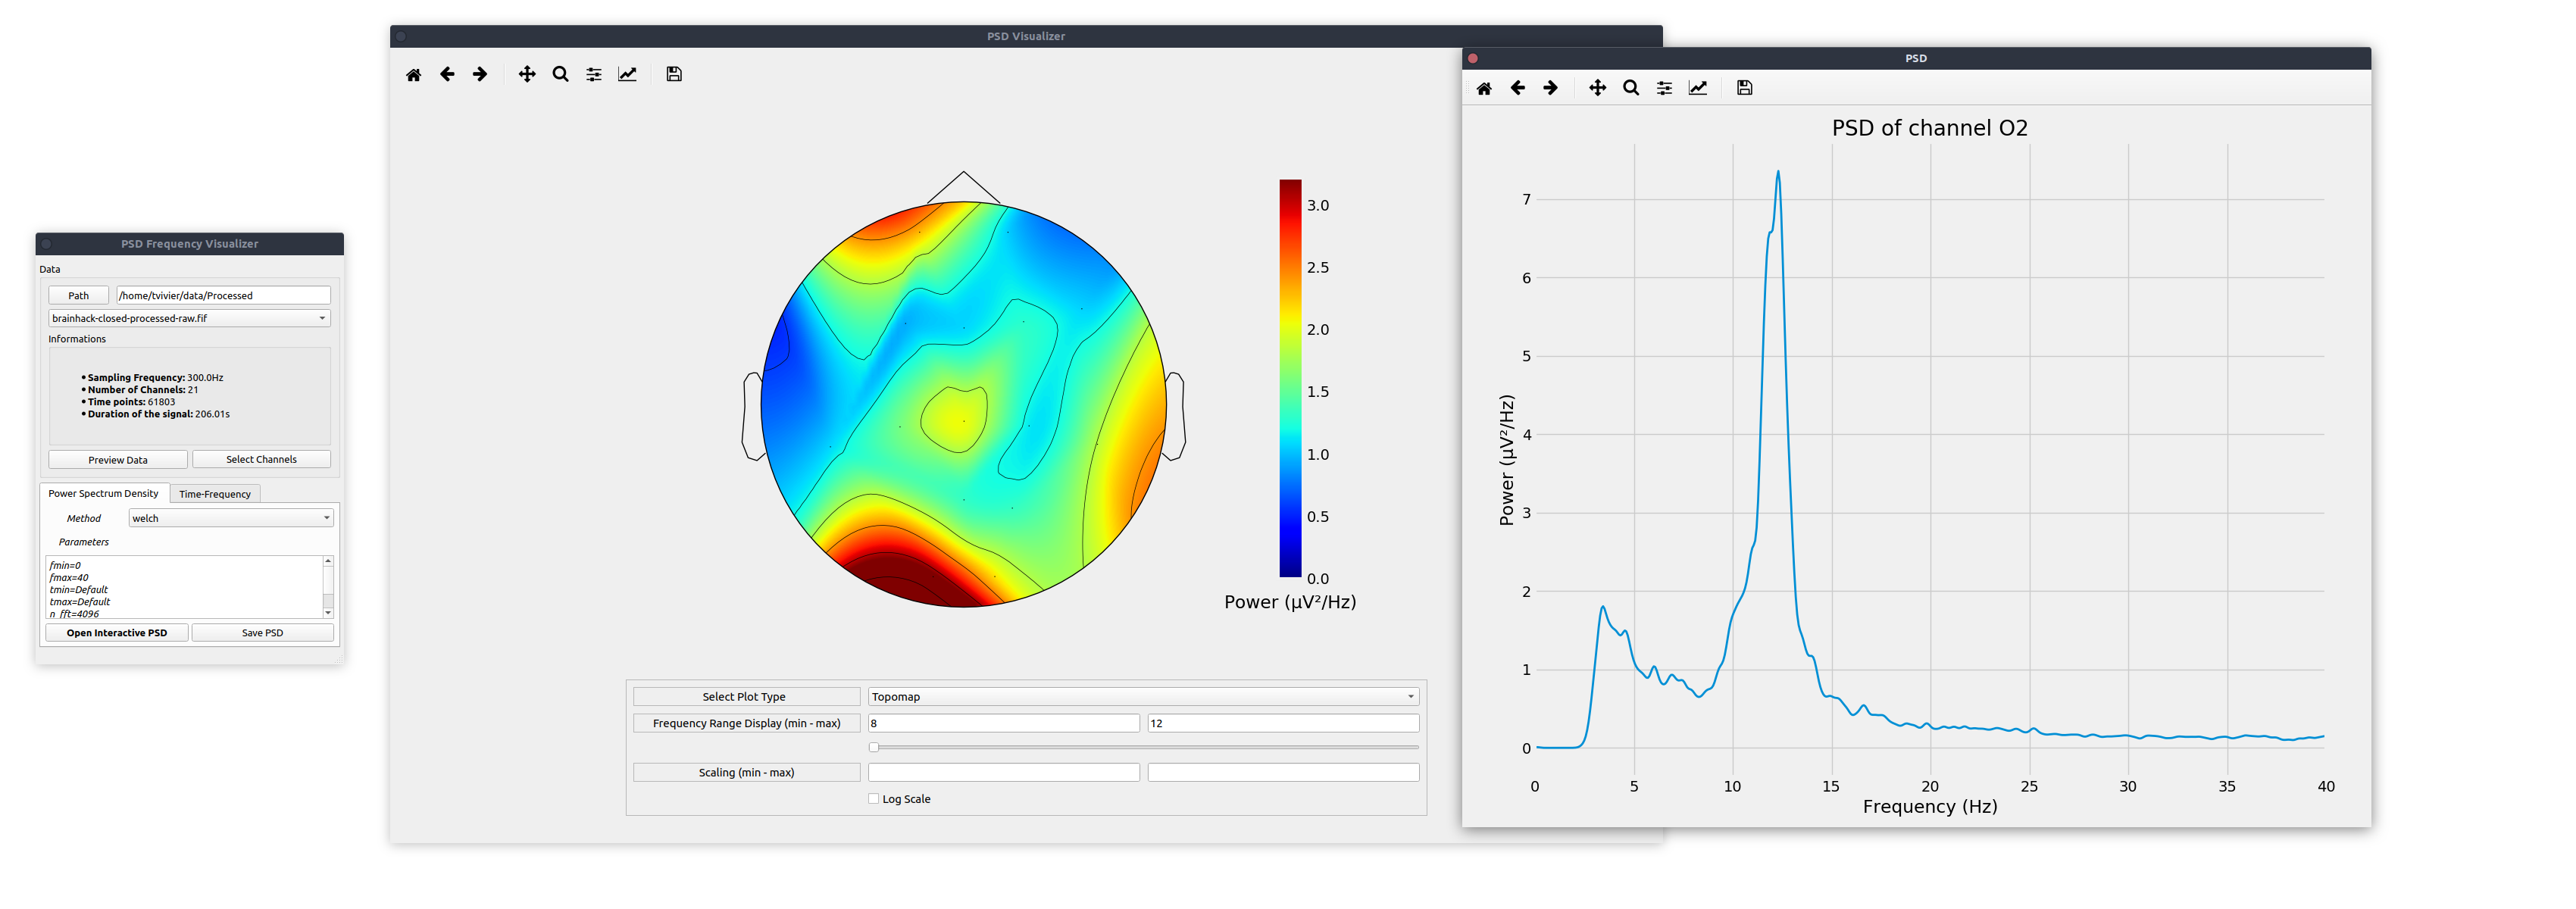
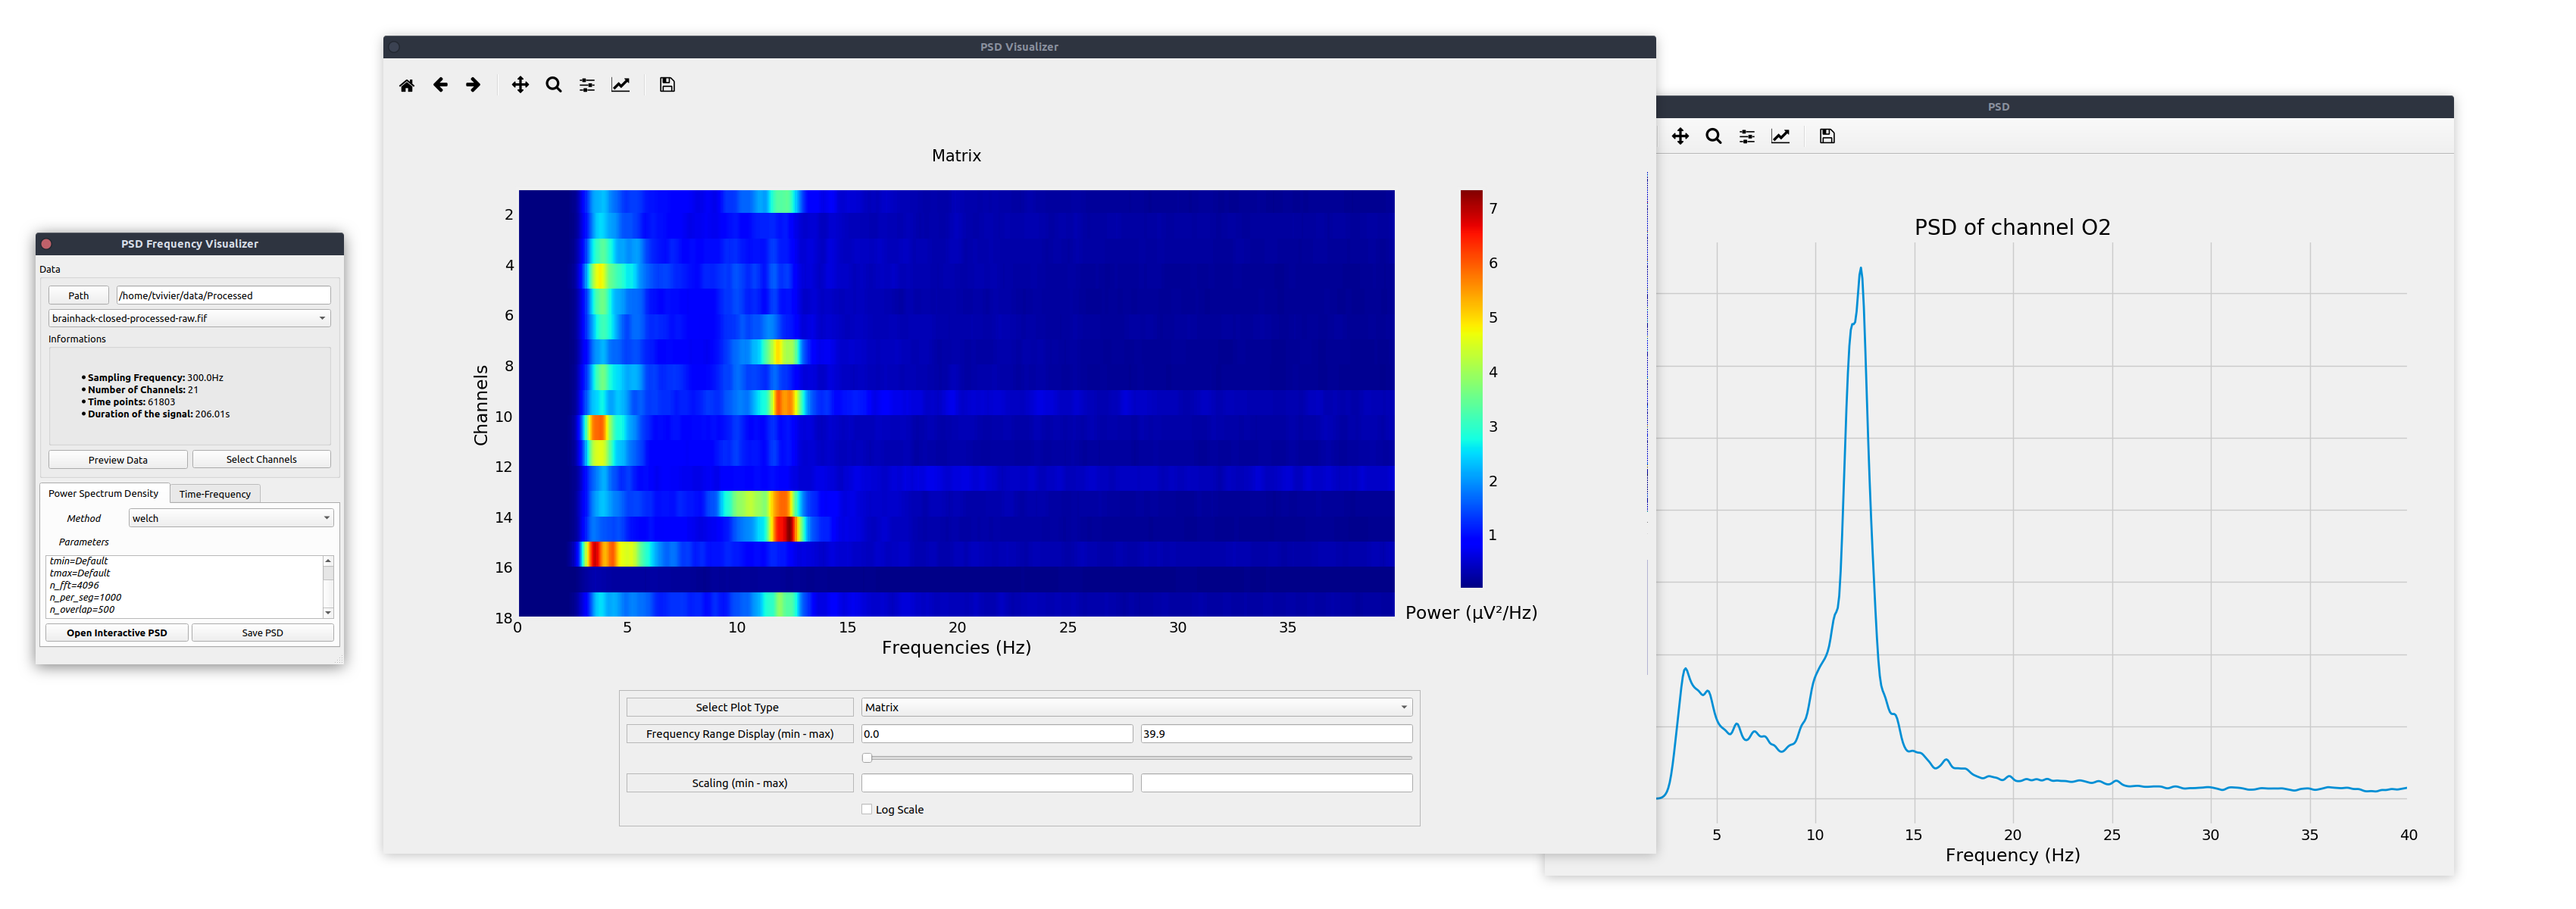
- PSD (Power Spectrum Density) : Which computes the power spectrum density of the signal. You can display the results either in the form of a matrix (Simple plot of individual Channels by Frequencies), or as a topomap (Power of electrode represented on the scalp). It is also possible to run across the different epochs if the file is epoched data. This gui also features a handy double click function that displays the PSD of the channel selected with the mouse.
- Average TFR (Average Time-Frequency) : Which computes the time-frequency representation of the signal averaged over epochs. This feature only works on epoched data. You can either display the results on regular time-frequency representation (Time by Frequency), or displays it in different ways (channels by frequencies, or channels by time).

You can easily import parameters using the import button in the app. The parameters are setup in a simple txt file, in the following way :
param_id = value
You can go on tutorial to find more informations about the parameters in the markdown file.