vtvt is an interactive tool for visualizing vectors and their transformations in R2. It's written in plain JavaScript (ECMAScript 2015) and utilizes html5 <canvas>.
Current version: 1.03 (2019-04-22)
Note on compatibility with v1.02:
Coordinate mapping function property is now called map_coords (previously, mapping)
- displays custom vectors, lines and points;
- supports object dragging (mouse or touch gestures);
- supports custom vector mapping (i.e. you can make a vector update its coordinates and colour in every frame based on some inputs, e.g. coordinates of other vectors);
- built-in calculation and display of eigenvectors;
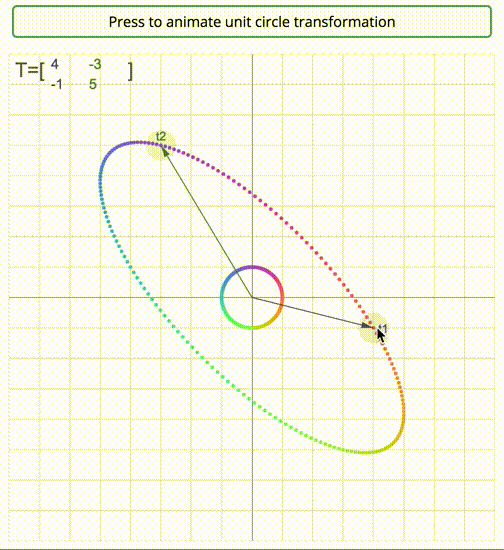
- can display an animated sequence of vectors (multiple vectors per frame are allowed);
- multi-platform support (tested with the following operating systems: MacOS Sierra, Windows 10, Ubuntu 16.04, iOS 12, Raspbian Stretch[rpi3]).
- Add a canvas element to your web page with its width and height specified (must be equal!) in CSS. Example:
<style>
    .canvas-wrapped { width: 90vmin; height: 90vmin; }
</style>
<canvas id='vector_canvas' class="canvas-wrapped">- If you are planning to create an animation sequence, add a trigger element as well, e.g.:
<button id='animation_trigger'>Press to animate</button>-
Initialize a scene (an instance of vtvt) using the canvas id (and the animation trigger element if applicable)
-
Add vectors (static and animated) to the scene
-
Render
var <scene> = new vtvt({canvas_id: '<canvas_id>', <aesthetic_args> });
<scene> is the scene object variable
<canvas_id> is the id of the canvas element
<aesthetic_args> control the looks of the scene. They should be specified as arg1:value1, arg2:value2, ..., argN:valueN. The following arguments can be specified:
| key | default value | Description |
|---|---|---|
| grid_res | 14 | the number of axis units per canvas width/height (grid lines are spaced one unit apart, so don't go crazy with this parameter) |
| snap_to_grid | true | round vector coordinates to the first decimal place |
| circle_rad | 0.5 | the size of the clickable/touchable area by which an object can be dragged around |
| point_rad | 0.06 | the size of the point (when a vector is rendered as a point) |
| rendering_scale | 1 | resolution upscaling factor; try setting to two on regular low-ppi monitors for sharper graphics (note: it also affects the size of vector arrows) |
| show_matrix | true | show the matrix determined by the first two vectors or not? |
| show_eig | true | show eigenvectors or not? |
| eig_col | "150, 150, 150" | eigenvector colour |
| eig_length | 4 | eigenvector length |
| frame_duration | 500 | time (ms) per animation frame |
| anim_trigger_id | '' | the id of the animation triger element (e.g., a button) |
Example:
scene = new vtvt({canvas_id: 'canvas1', grid_res: 16, circle_rad: 0.5, show_eig: false});To add vectors that are always rendered use the following method:
<scene>.addVector({coords: [<coord_x>, <coord_y>], origin: [<coord_x>, <coord_y>], <aesthetic_args>});
| key | default | Description |
|---|---|---|
| coords | [1,1] | vector coordinates (relative to the point of origin) |
| origin | [0,0] | coordinates of vector origin (same as displacement vector coordinates) |
<aesthetic_args> (format: arg1:value1, arg2:value2, ..., argN:valueN):
| key | default | Description |
|---|---|---|
| c | "150, 150, 150" | colour (RGB 0-255) |
| label | '' | vector label |
| draggable | false | can the object be dragged? |
| visible | true | should the object be visible? |
| kind | 'vector' | an easy way to specify what the object should look like: 'vector', 'line', 'point' or 'custom' |
| draw_arrow | true | (applies if kind: 'custom') draw the arrowhead? |
| draw_point | false | (applies if kind: 'custom') draw a point at [coord_x, coord_y]? |
| draw_stem | true | (applies if kind: 'custom') draw the vector stem? |
| draw_line | false | (applies if kind: 'custom') draw a line across the whole screen? |
| map_coords | undefined | a function mapping vector coordinates (refer to the following section for details) |
| map_col | undefined | a function mapping vector colour (refer to the following section for details) |
Example:
scene.addVector({
    coords: [-1, 3], c: "250, 200, 200", label: "m = t1+t2", visible: true,
    map_coords: function(){
        return {mapX: scene.vectors[0].coord_x + scene.vectors[1].coord_x,
                mapY: scene.vectors[0].coord_y + scene.vectors[1].coord_y};
    }
});
Note: the first two vectors (regardless of their aesthetic arguments) created via <scene>.addVector() determine the columns of matrix T (which is displayed on the canvas unless the scene was initialized with show_matrix:false). If show_eig is true, then this matrix will be used to calculate the corresponding eigenvectors and eigenvalues.
If you want to update a vector's coordinates based on other vectors, this can be done by specifying a mapping function that returns the following object:
{
    mapXo: <origin displacement: coordinate x>,
    mapYo: <origin displacement: coordinate y>,
    mapX: <vector coordinates: x (relative to the the point of origin)>,
    mapY: <vector coordinates: y (relative to the the point of origin)>
}
You can access the i-th vector's coordinates with <scene>.vectors[i].coord_x and .coord_y. The coordinates of the origin point can be accessed with <scene>.vectors[i].orig_x and .orig_y. Please note that the array of vectors is 0-indexed, so the first vector you add with <scene>.addVector() is <scene>.vectors[0], the second vector is <scene>.vectors[1], and so on.
If you want to map only the point of origin, you car return an object specifying just mapXo and mapYo. Similarly if you want to map only the coordinates, the object may contain just mapX and mapY. Please note if the object contains mapX or mapY, the vector will not be draggable.
In some cases you might need to map the first two vectors (which define matrix T used for eigen-calculations) to vectors added afterwards. An attempt to initialize them with the mapping function specified will fail because the mapping refers to vectors which have not been initialized yet. The workaround is to initialize the first two vectors without the mapping function, initialize the rest of the vectors, and then assign the mapping function to scene.vectors[<0|1>].mapping. The following example turns the first two vectors into the columns of a covariance matrix:
scene.vectors[0].mapping = function() {
    let sumX2 = 0, sumY2 = 0, sumXY = 0;
    for (let k = 2; k < numPoints+2; k++) {
        sumX2   += scene.vectors[k].coord_x * scene.vectors[k].coord_x;
        sumXY   += scene.vectors[k].coord_x * scene.vectors[k].coord_y;
    }
    return {mapX: sumX2/numPoints, mapY: sumXY/numPoints};
}

scene.vectors[1].mapping = function() {
    let sumX2 = 0, sumY2 = 0, sumXY = 0;
    for (let k = 2; k < numPoints+2; k++) {
        sumY2   += scene.vectors[k].coord_y * scene.vectors[k].coord_y;
        sumXY   += scene.vectors[k].coord_x * scene.vectors[k].coord_y;
    }
    return {mapX: sumXY/numPoints, mapY: sumY2/numPoints};
}
It is also possible to map a vector's colour to some inputs. For that you'll need a function that returns `${Math.round(red)}, ${Math.round(green)}, ${Math.round(blue)}`;, where red, green and blue are some variables that range from 0 to 255. Rounding of float values is necessary to avoid issues in some browsers.
Please refer to the demo files for additional examples of specifying the mapping functions (demo #8 for colour mapping).
Vectors from the animated sequence are rendered only once the animation is triggered. To add one frame to the sequence use
<scene>.addAnimationFrame([<args_obj_1, args_obj_2, ..., args_obj_N]);
where N is the number of animated vectors shown in this frame
each args_obj_K = {coords: [<coord_x>, <coord_y>], origin: [<coord_x>, <coord_y>], <aesthetic_args>}
The aesthetic arguments are the same as for <scene>.addVector()
.addAnimationFrame() always takes an array as its argument. Even if you want only one animated vector per frame, it still needs to surrounded by the square brackets.
You can access the k-th animated vector's coordinates in the i-th frame with <scene>.vectors_animated[i][k].coord_x and .coord_y. The coordinates of the origin point can be accessed with <scene>.vectors_animated[i][k].orig_x and .orig_y
Example:
scene.addAnimationFrame([{coords: [1, 1], c: "150, 100, 100", label: "iter0", map_coords: function(){
return {mapX: scene.vectors[2].coord_x, mapY: scene.vectors[2].coord_y} }]);When something doesn't work, first blame me check your browser's console for error messages. Most likely, the arguments to .addVector() or .addAnimationFrame() are messed up. Errors in custom mapping functions are fairly common as well. Try probing vector objects in the console (e.g., scene.vectors[i]) to see what they look like.
If you're lost or you suspect something is wrong with vtvt, report the issue on github.
v1.01 2019-01-14
- updated readme
- class vtvt: new 'point_rad' property
- class Vector:
- property 'selectable' renamed as 'draggable'
- new properties:
- kind
- draw_point
- draw_stem
- methods modified:
- addVector() — the argument is now an object
- addAnimationFrame() — the argument is now a list of objects
v1.02 2019-02-18
- updated readme
- class vtvt: new 'show_matrix' property
- class Vector:
- new 'origin' property
- updated all methods to support origin displacement
- mapping function should now return an object instead of an array
- updated demos
v1.03 2019-04-22
- updated readme
- class Vector:
- renamed mapping function property (
mapping->map_coords) - added colour mapping (property:
map_col)
- renamed mapping function property (
- add grid transformation
- add support for displaying arbitrary text
- show matrix T in a separate html element
- use camelCase for variable names
The source, demos and this reference are available from the github repository. The code is distributed under the terms of the MIT license. Thanks to u/senocular and u/theogjpeezy from reddit for answering a few questions I had about js while working on vtvt.