


Lighthouse analyzes web apps and web pages, collecting modern performance metrics and insights on developer best practices.
- Using Lighthouse
- Viewing a report
- Docs & Recipes
- Developing Lighthouse
- Associated Products and Projects
- FAQ
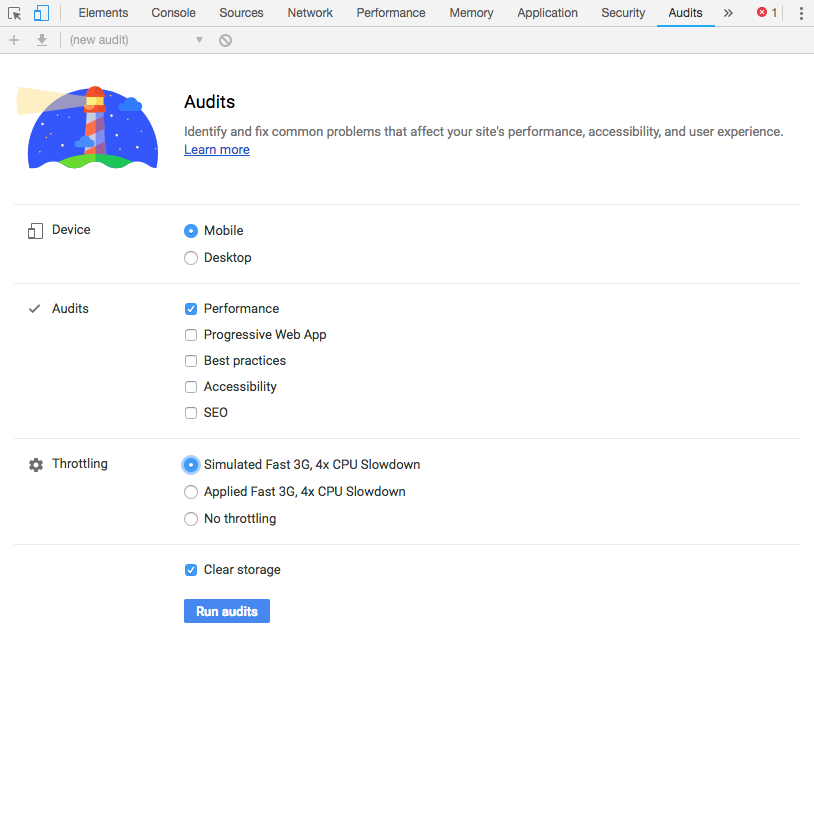
Lighthouse is integrated directly into the Chrome Developer Tools, under the "Audits" panel.
Installation: install Chrome.
Run it: open Chrome DevTools, select the Audits panel, and hit "Run audits".
The Chrome extension was available prior to Lighthouse being available in Chrome Developer Tools, and offers similar functionality.
Installation: install the extension from the Chrome Web Store.
Run it: follow the extension quick-start guide.
The Node CLI provides the most flexibility in how Lighthouse runs can be configured and reported. Users who want more advanced usage, or want to run Lighthouse in an automated fashion should use the Node CLI.
Lighthouse requires Node 10 LTS (10.13) or later.
Installation:
npm install -g lighthouse
# or use yarn:
# yarn global add lighthouse
Run it: lighthouse https://airhorner.com/
By default, Lighthouse writes the report to an HTML file. You can control the output format by passing flags.
$ lighthouse --help

lighthouse <url>

Logging:
  --verbose  Displays verbose logging                                                                                                      [boolean]
  --quiet    Displays no progress, debug logs or errors                                                                                    [boolean]

Configuration:
  --save-assets                  Save the trace & devtools log to disk                                                                     [boolean]
  --list-all-audits              Prints a list of all available audits and exits                                                           [boolean]
  --list-trace-categories        Prints a list of all required trace categories and exits                                                  [boolean]
  --print-config                 Print the normalized config for the given config and options, then exit.                                  [boolean]
  --additional-trace-categories  Additional categories to capture with the trace (comma-delimited).
  --config-path                  The path to the config JSON.
                                 An example config file: lighthouse-core/config/lr-desktop-config.js
  --budget-path                  The path to the budget.json file for LightWallet.
  --chrome-flags                 Custom flags to pass to Chrome (space-delimited). For a full list of flags, see
                                 http://peter.sh/experiments/chromium-command-line-switches/.

                                 Environment variables:
                                 CHROME_PATH: Explicit path of intended Chrome binary. If set must point to an executable of a build of
                                 Chromium version 66.0 or later. By default, any detected Chrome Canary or Chrome (stable) will be launched.
                                                                                                                                       [default: ""]
  --port                         The port to use for the debugging protocol. Use 0 for a random port                                    [default: 0]
  --preset                       Use a built-in configuration.                                            [choices: "full", "perf", "mixed-content"]
                                 WARNING: If the --config-path flag is provided, this preset will be ignored.
  --hostname                     The hostname to use for the debugging protocol.                                              [default: "localhost"]
  --max-wait-for-load            The timeout (in milliseconds) to wait before the page is considered done loading and the run should continue.
                                 WARNING: Very high values can lead to large traces and instability                                 [default: 45000]
  --emulated-form-factor         Controls the emulated device form factor (mobile vs. desktop) if not disabled                      [choices: "mobile", "desktop", "none"] [default: "mobile"]
  --enable-error-reporting       Enables error reporting, overriding any saved preference. --no-enable-error-reporting will do the opposite. More:
                                 https://git.io/vFFTO
  --gather-mode, -G              Collect artifacts from a connected browser and save to disk. If audit-mode is not also enabled, the run will quit
                                 early.                                                                                                    [boolean]
  --audit-mode, -A               Process saved artifacts from disk                                                                         [boolean]

Output:
  --output       Reporter for the results, supports multiple values                        [choices: "json", "html", "csv"] [default: "html"]
  --output-path  The file path to output the results. Use 'stdout' to write to stdout.
                 If using JSON output, default is stdout.
                 If using HTML or CSV output, default is a file in the working directory with a name based on the test URL and date.
                 If using multiple outputs, --output-path is appended with the standard extension for each output type. "reports/my-run" -> "reports/my-run.report.html", "reports/my-run.report.json", etc.
                 Example: --output-path=./lighthouse-results.html
  --view         Open HTML report in your browser                                                                                          [boolean]

Options:
  --help                        Show help                                                                                                  [boolean]
  --version                     Show version number                                                                                        [boolean]
  --cli-flags-path              The path to a JSON file that contains the desired CLI flags to apply.
                                Flags specified at the command line will still override the file-based ones.
  --blocked-url-patterns        Block any network requests to the specified URL patterns                                                     [array]
  --disable-storage-reset       Disable clearing the browser cache and other storage APIs before a run                                     [boolean]
  --throttling-method                  Controls throttling method         [choices: "devtools", "provided", "simulate"]
  --throttling.rttMs                   Controls simulated network RTT (TCP layer)
  --throttling.throughputKbps          Controls simulated network download throughput
  --throttling.requestLatencyMs        Controls emulated network RTT (HTTP layer)
  --throttling.downloadThroughputKbps  Controls emulated network download throughput
  --throttling.uploadThroughputKbps    Controls emulated network upload throughput
  --throttling.cpuSlowdownMultiplier   Controls simulated + emulated CPU throttling
  --extra-headers               Set extra HTTP Headers to pass with request                                                                 [string]

Examples:
  lighthouse <url> --view                                                   Opens the HTML report in a browser after the run completes
  lighthouse <url> --config-path=./myconfig.js                              Runs Lighthouse with your own configuration: custom audits, report
                                                                            generation, etc.
  lighthouse <url> --output=json --output-path=./report.json --save-assets  Save trace, devtoolslog, and named JSON report.
  lighthouse <url> --emulated-form-factor=none                              Disable device emulation and all throttling.
    --throttling-method=provided
  lighthouse <url> --chrome-flags="--window-size=412,660"                   Launch Chrome with a specific window size
  lighthouse <url> --quiet --chrome-flags="--headless"                      Launch Headless Chrome, turn off logging
  lighthouse <url> --extra-headers "{\"Cookie\":\"monster=blue\"}"          Stringify\'d JSON HTTP Header key/value pairs to send in requests
  lighthouse <url> --extra-headers=./path/to/file.json                      Path to JSON file of HTTP Header key/value pairs to send in requests
  lighthouse <url> --only-categories=performance,pwa                        Only run the specified categories. Available categories: accessibility,
                                                                            best-practices, performance, pwa, seo.

For more information on Lighthouse, see https://developers.google.com/web/tools/lighthouse/.
lighthouse
# saves `./<HOST>_<DATE>.report.html`

lighthouse --output json
# json output sent to stdout

lighthouse --output html --output-path ./report.html
# saves `./report.html`

# NOTE: specifying an output path with multiple formats ignores your specified extension for *ALL* formats
lighthouse --output json --output html --output-path ./myfile.json
# saves `./myfile.report.json` and `./myfile.report.html`

lighthouse --output json --output html
# saves `./<HOST>_<DATE>.report.json` and `./<HOST>_<DATE>.report.html`

lighthouse --output-path=~/mydir/foo.out --save-assets
# saves `~/mydir/foo.report.html`
# saves `~/mydir/foo-0.trace.json` and `~/mydir/foo-0.devtoolslog.json`

lighthouse --output-path=./report.json --output json
# saves `./report.json`You can run a subset of Lighthouse's lifecycle if desired via the --gather-mode (-G) and --audit-mode (-A) CLI flags.
lighthouse http://example.com -G
# launches browser, collects artifacts, saves them to disk (in `./latest-run/`) and quits

lighthouse http://example.com -A
# skips browser interaction, loads artifacts from disk (in `./latest-run/`), runs audits on them, generates report

lighthouse http://example.com -GA
# Normal gather + audit run, but also saves collected artifacts to disk for subsequent -A runs.


# You can optionally provide a custom folder destination to -G/-A/-GA. Without a value, the default will be `$PWD/latest-run`.
lighthouse -GA=./gmailartifacts https://gmail.comThe first time you run the CLI you will be prompted with a message asking you if Lighthouse can anonymously report runtime exceptions. The Lighthouse team uses this information to detect new bugs and avoid regressions. Opting out will not affect your ability to use Lighthouse in any way. Learn more.
You can also use Lighthouse programmatically with the Node module.
Read Using Lighthouse programmatically for help getting started.
Read Lighthouse Configuration to learn more about the configuration options available.
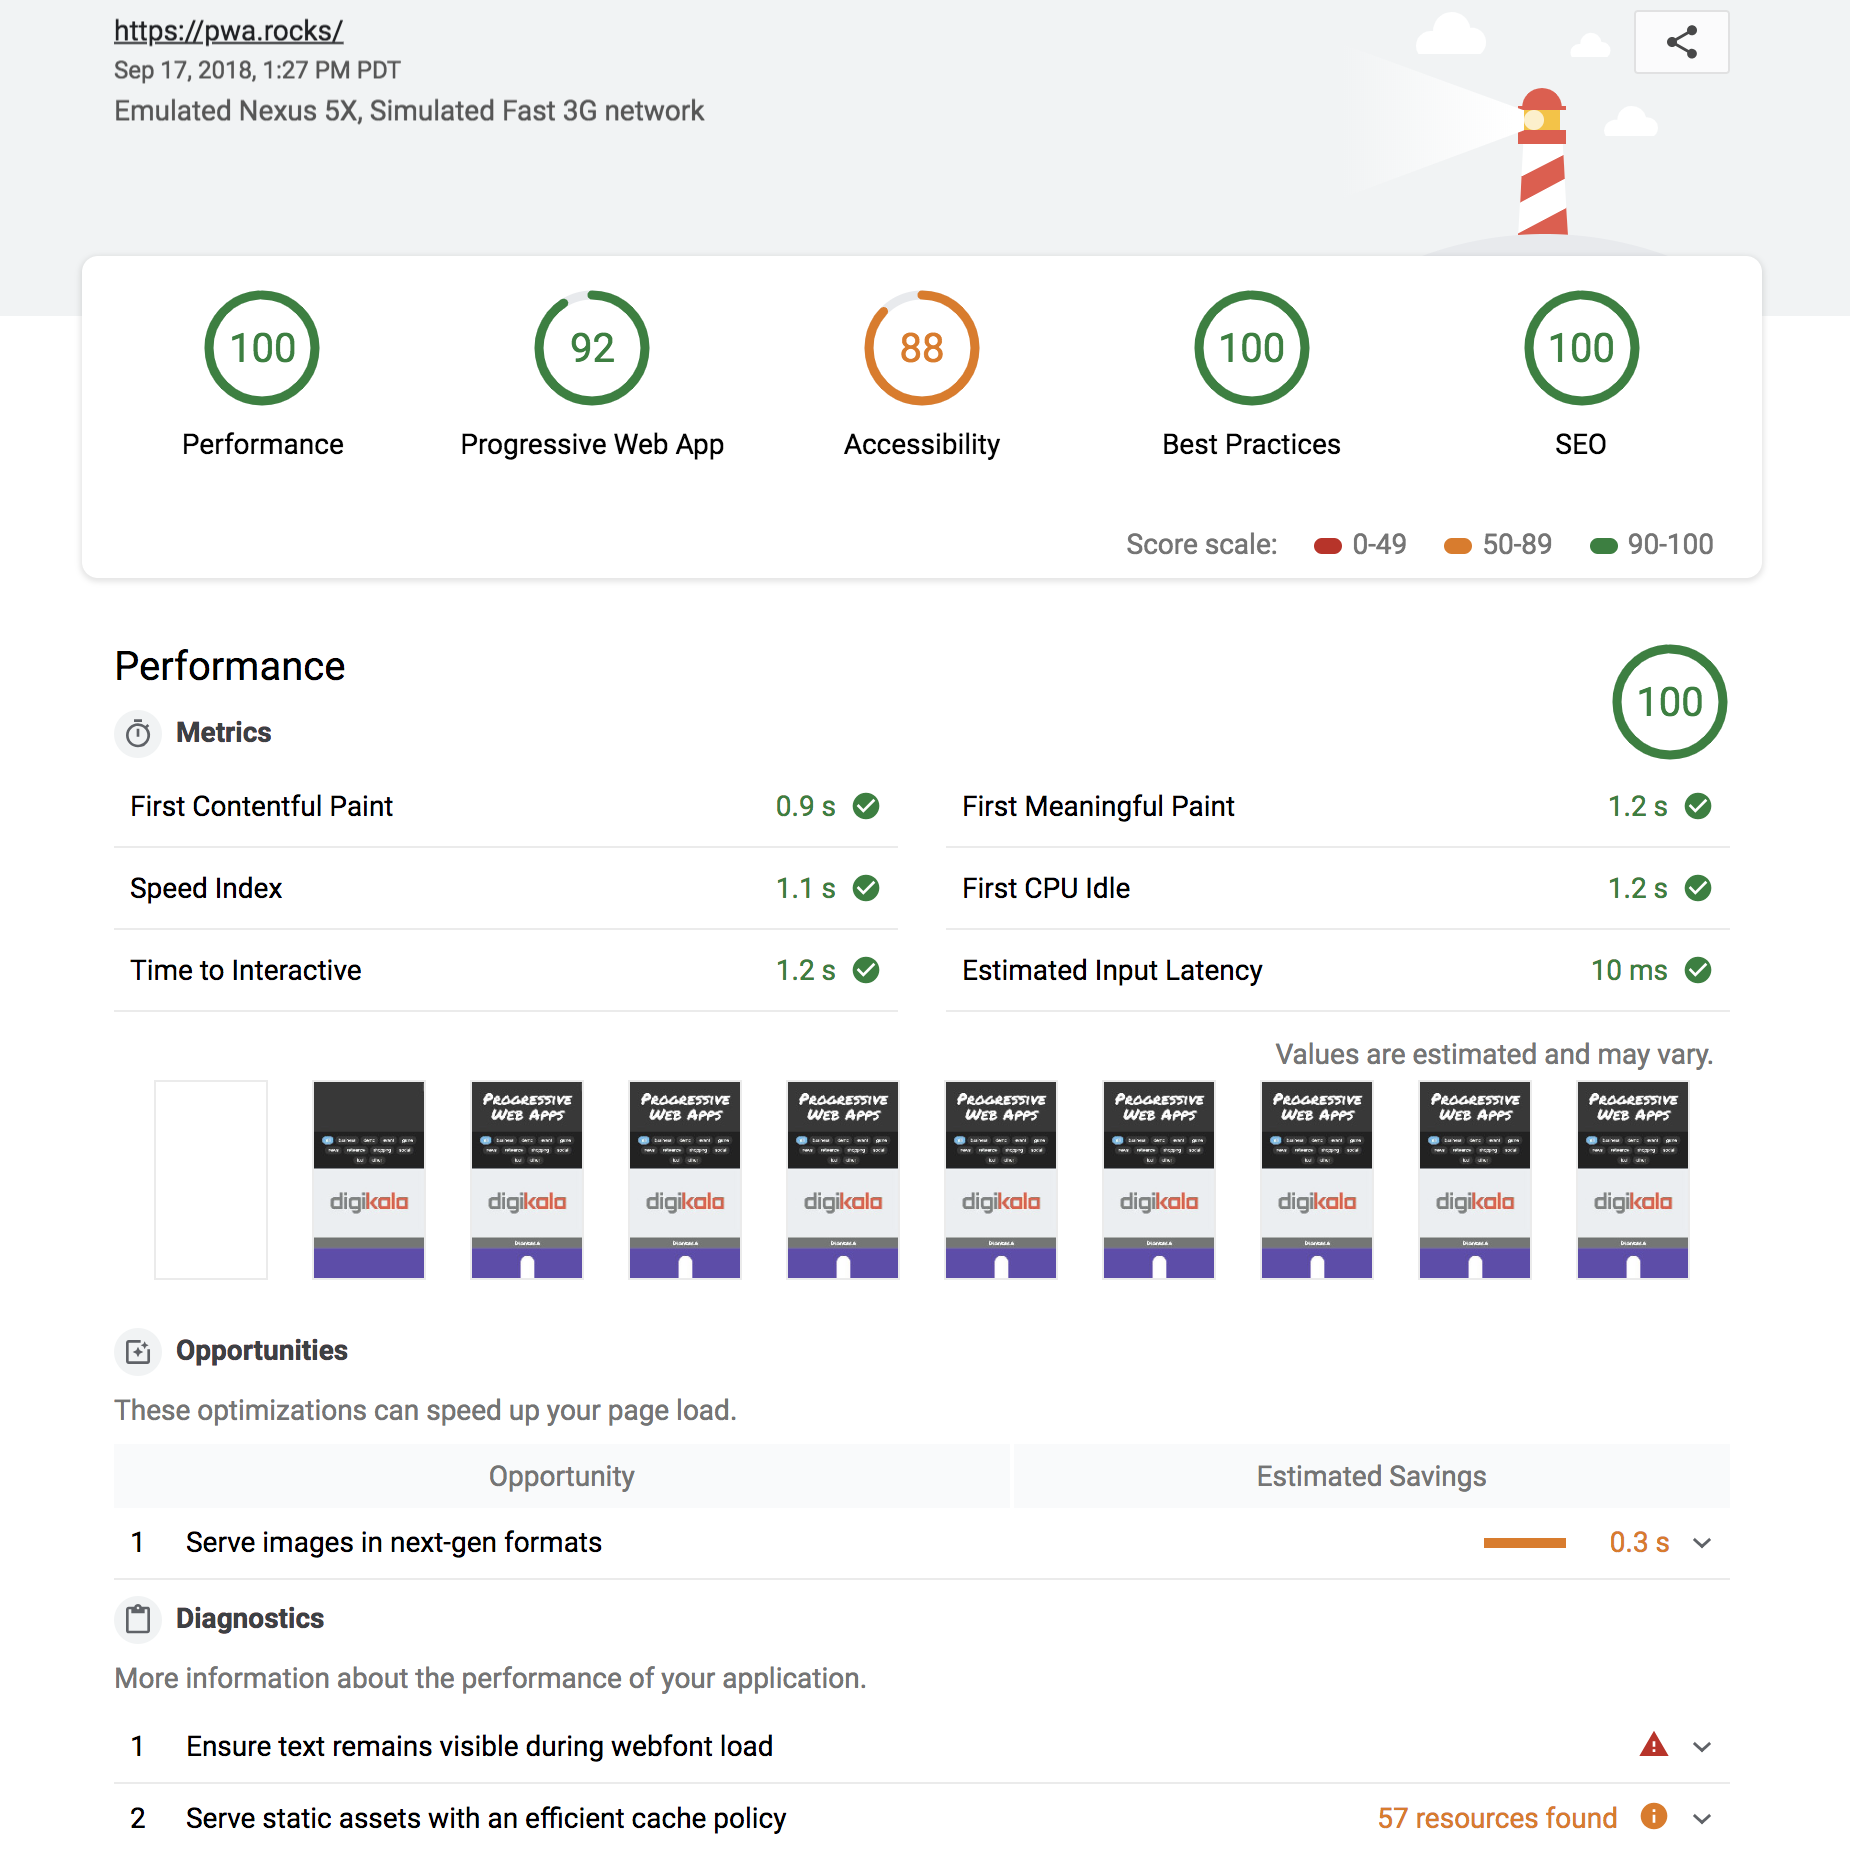
Lighthouse can produce a report as JSON or HTML.
HTML report:
Running Lighthouse with the --output=json flag generates a JSON dump of the run.
You can view this report online by visiting https://googlechrome.github.io/lighthouse/viewer/
and dragging the file onto the app. You can also use the "Export" button from the
top of any Lighthouse HTML report and open the report in the
Lighthouse Viewer.
In the Viewer, reports can be shared by clicking the share icon in the top right corner and signing in to GitHub.
Note: shared reports are stashed as a secret Gist in GitHub, under your account.
Useful documentation, examples, and recipes to get you started.
Docs
- Dealing with variance
- Using Lighthouse programmatically
- Testing a site with authentication
- Developing Plugins
- Making a New Audit
- Testing on a mobile device
- Setting a performance budget
- Lighthouse Architecture
Recipes
- gulp - helpful for CI integration
- Plugin - example Lighthouse plugin
- Custom Audit example - extend Lighthouse, run your own audits
Videos
The session from Google I/O 2018 covers the new performance engine, upcoming Lighthouse REST API, and using the Chrome UX report to evaluate real-user data.

The session from Google I/O 2017 covers architecture, writing custom audits, GitHub/Travis/CI integration, headless Chrome, and more:

click to watch the video
Read on for the basics of hacking on Lighthouse. Also, see Contributing for detailed information.
# yarn should be installed first

git clone https://github.com/GoogleChrome/lighthouse

cd lighthouse
yarn
yarn build-allIf changing audit output, you'll need to have v3.7.1 of the protocol-buffer/protobuf compiler installed. (v3.7.1 is known to be compatible, and 3.11.x is known to be not compatible.).
Homebrew should be able to install it correctly: brew install protobuf@3.7
But if you want to do it manually, these steps that have worked well for us:
mkdir protobuf-install && cd protobuf-install
curl -L -o protobuf-python-3.7.1.zip https://github.com/protocolbuffers/protobuf/releases/download/v3.7.1/protobuf-python-3.7.1.zip
unzip protobuf-python-3.7.1.zip
cd protobuf-3.7.1

cd python
python setup.py build
python setup.py test
(cd .. && autogen.sh && configure && make)
(cd .. && sudo make install)
python setup.py build --cpp_implementation
sudo python setup.py install --cpp_implementation
Also, see the official installation instructions.
node lighthouse-cli http://example.com
# append --chrome-flags="--no-sandbox --headless --disable-gpu" if you run into problems connecting to Chrome
Getting started tip:
node --inspect-brk lighthouse-cli http://example.comto open up Chrome DevTools and step through the entire app. See Debugging Node.js with Chrome DevTools for more info.
# lint and test all files
yarn test

# watch for file changes and run tests
#   Requires http://entrproject.org : brew install entr
yarn watch

## run linting, unit, and smoke tests separately
yarn lint
yarn unit
yarn smoke

## run tsc compiler
yarn type-checkSome of our docs have tests that run only in CI by default. If you end up needing to modify our documentation, you'll need to run yarn test-docs locally to make sure they pass.
Additional Dependencies
brew install jq
This section details services that have integrated Lighthouse data. If you're working on a cool project integrating Lighthouse and would like to be featured here, file an issue to this repo or tweet at us @_____lighthouse!
-
HTTPArchive - HTTPArchive tracks how the web is built by crawling 500k pages with Web Page Test, including Lighthouse results, and stores the information in BigQuery where it is publicly available.
-
Lighthouse Keeper - Lighthouse Keeper monitors your pages' Lighthouse scores and notifies you if they drop below your thresholds. Lighthouse Keeper is a free service that monitors up to 3 URLs once per day.
-
Web Page Test — An open source tool for measuring and analyzing the performance of web pages on real devices. Users can choose to produce a Lighthouse report alongside the analysis of WebPageTest results.
-
AwesomeTechStack — AwesomeTechStack is a free to use website tech stack analyzer. AwesomeTechStack provides insights into the security, modernity, and performance of any website's technology stack and guidance to improve performance. Lighthouse insights are a crucial part of a website's tech stack rating.
-
Automated Lighthouse Check - Lighthouse-as-a-service offering free and premium plans. Provides monitoring and historical reporting of Lighthouse audits with CircleCI, GitHub, and other integrations. Features include Slack notifications, PR comment reporting and more.
-
Calibre - Calibre is a comprehensive performance monitoring platform running on Lighthouse. See the performance impact of your work before it hits production with GitHub Pull Request Reviews. Track the impact of Third Party scripts. Automate your performance system with a developer-first Node.js API. Try Calibre with a free 15-day trial.
-
DebugBear - DebugBear is a website monitoring tool based on Lighthouse. See how your scores and metrics changed over time, with a focus on understanding what caused each change. DebugBear is a paid product with a free 30-day trial.
-
Fluxguard - Fluxguard provides website DOM change monitoring orchestrated with Google Puppeteer, and audited by Lighthouse. Fluxguard is a freemium product, with monthly monitoring of up to 75 pages for free.
-
PageSpeed Green - Web performance monitoring service for web sites. Track PageSpeed performance indicators for unlimited web pages from multiple regions. Check all code changes for PageSpeed degradations by integrating to your CD/CI using CLI. Powered By Google Lighthouse and Puppeteer. PageSpeed Green is a paid product with a free 14-day trial.
-
SEO Guard — SEO Guard is a website monitoring solution. It provides metrics based on Lighthouse scores. The service is offered via free and paid premium plans.
-
SpeedCurve — SpeedCurve is a tool for continuously monitoring web performance across different browsers, devices, and regions. It can aggregate any metric including Lighthouse scores across multiple pages and sites, and allows you to set performance budgets with Slack or email alerts. SpeedCurve is a paid product with a free 30-day trial.
-
Siteimprove Performance — Siteimprove Performance is a web Performance monitoring solution that enables a marketer, manager or decision maker to understand and optimize website load times. Get easy-to-use insights with a focus on quick and impactful wins. Siteimprove Performance is a paid product with a free 14-day trial.
-
Speedrank - Speedrank monitors the performance of your website in the background. It displays Lighthouse reports over time and delivers recommendations for improvement. Speedrank is a paid product with 14-day-trial.
-
Treo - Treo is Lighthouse as a Service. It provides regression testing, geographical regions, custom networks, and integrations with GitHub & Slack. Treo is a paid product with plans for solo-developers and teams.
- lighthouse-plugin-field-performance - a plugin that adds real-user performance metrics for the URL using the data from Chrome UX Report.
Other awesome open source projects that use Lighthouse.
- auto-lighthouse - a CLI for crawling a domain and generating mobile and desktop reports for each page.
- Exthouse - Analyze the impact of a browser extension on web performance.
- Garie - An open source tool for monitoring performance using Lighthouse, PageSpeed Insights, Prometheus, Grafana and Docker.
- Gimbal - An open source (MIT licensed) tool used to measure, analyze, and budget aspects of a web application. Gimbal also integrates reports with GitHub pull requests.
- Gradle Lighthouse Plugin - An open source Gradle plugin that runs Lighthouse tests on multiple URLs and asserts category score thresholds (useful in continuous integration).
- lightcrawler - Crawl a website and run each page found through Lighthouse.
- lighthouse-badges - Generate gh-badges (shields.io) based on Lighthouse performance.
- lighthouse-batch - Run Lighthouse over a number of sites and generate a summary of their metrics/scores.
- lighthouse-batch-parallel - Run multiple Lighthouse runs in parallel to accelerate the data collecting process, get the result stream (csv, json, js object) in your own process (warning: performance results may be volatile).
- lighthouse-check-action - A Github Action to run Lighthouse in a workflow, featuring Slack notifications and report upload to S3.
- lighthouse-check-orb - A CircleCI Orb to run Lighthouse in a workflow, featuring Slack notifications and report upload to S3.
- andreasonny83/lighthouse-ci - Run Lighthouse and assert scores satisfy your custom thresholds.
- GoogleChrome/lighthouse-ci - (official) Automate running Lighthouse for every commit, viewing the changes, and preventing regressions.
- lighthouse-ci-action - A Github Action that makes it easy to run Lighthouse in CI and keep your pages small using performance budgets.
- lighthouse-cron - Cron multiple batch Lighthouse audits and emit results for sending to remote server.
- lighthouse-gh-reporter - Run Lighthouse in CI and report back in a comment on your pull requests
- lighthouse-hue - Set the color of Philips Hue lights based on a Lighthouse score
- lighthouse-jest-example - Gather performance metrics via Lighthouse and assert results with Jest; uses Puppeteer to start Chrome with network emulation settings defined by WebPageTest.
- lighthouse-lambda - Run Lighthouse on AWS Lambda with prebuilt stable desktop Headless Chrome.
- lighthouse-magic-light - Set the color of the MagicLight Bluetooth Smart Light Bulb based on Lighthouse score
- lighthouse-mocha-example - Run Lighthouse performance tests with Mocha and chrome-launcher.
- lighthouse-monitor - Run Lighthouse against all your URLs. Send metrics to any backend you want, save all reports with automatic data retention, and compare any two results in a web UI.
- lighthouse-persist - Run Lighthouse and upload HTML reports to an AWS S3 bucket.
- lighthouse4u - LH4U provides Google Lighthouse as a service, surfaced by both a friendly UI+API, and backed by Elastic Search for easy querying and visualization.
- performance-budgets - Easily assert Lighthouse budgets with Docker.
- pwmetrics - Gather performance metrics
- react-lighthouse-viewer - Render a Lighthouse JSON report in a React Component.
- webpack-lighthouse-plugin - Run Lighthouse from a Webpack build.
- is-website-vulnerable - An open source Node.js CLI tool that finds publicly known security vulnerabilities in a website's frontend JavaScript libraries.
Lighthouse reports the performance metrics as they would be experienced by a typical mobile user on a 4G connection and a mid-tier ~$200 phone. Even if it loads quickly on your device and network, users in other environments will experience the site very differently.
Read more in our guide to throttling.
Lighthouse performance scores will change due to inherent variability in web and network technologies, even if there hasn't been a code change. Test in consistent environments, run Lighthouse multiple times, and beware of variability before drawing conclusions about a performance-impacting change.
Read more in our guide to reducing variability.
Yes! Details in Lighthouse configuration.
Good question. Network and CPU throttling are applied by default in a Lighthouse run. The network
attempts to emulate slow 4G connectivity and the CPU is slowed down 4x from your machine's default speed. If you
prefer to run Lighthouse without throttling, you'll have to use the CLI and disable it with the
--throttling.* flags mentioned above.
Read more in our guide to network throttling.
Nope. Lighthouse runs locally, auditing a page using a local version of the Chrome browser installed on the machine. Report results are never processed or beaconed to a remote server.
Tip: see Lighthouse Architecture for more information on terminology and architecture.
Lighthouse can be extended to run custom audits and gatherers that you author. This is great if you're already tracking performance metrics in your site and want to surface those metrics within a Lighthouse report.
If you're interested in running your own custom audits, check out our Custom Audit Example over in recipes.
We'd love help writing audits, fixing bugs, and making the tool more useful! See Contributing to get started.
![]()
Lighthouse, ˈlītˌhous (n): a tower or other structure tool containing a beacon light
to warn or guide ships at sea developers.