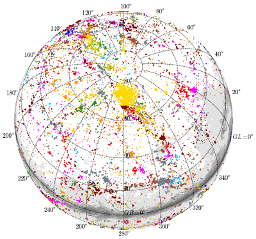
- Introduction: skyplot
- Visulaizing Galaxy Groups (skyplot_group.py)
- Demo (Virgo Cluster)
- Features
- Visulaizing Galaxy Groups Associations (skyplot_supergroup.py)
- Dependencies
Tools to visualize the 2D sky projection of groups and associations discussed in Kourkchi and Tully (2017, ApJ, 843, 16), Galaxy Groups Within 3,500 km/s.
Click here to see the paper: http://adsabs.harvard.edu/abs/2017ApJ...843...16K
Codes to generate the catalogs (all.iter.2.v41.group and all.iter.2.v41.supergroup) that are used for visualizations, are available in https://github.com/ekourkchi/GalaxyGroups The offical catalog is available online at Extragalactic Distance Database (under Kourkchi-Tully table): http://edd.ifa.hawaii.edu/dfirst.php
- How to run (example): Looking at the direction of the Virgo cluster, in Supergalactic coordinate
$ python skyplot_group.py -f all.iter.2.v41.group -c supergalactic -a 102 -d -2 w 50
- How to get help:
$ python skyplot_group.py -h
- Commnad line options:
        -h, --help            show this help message and exit
          -a ALPHA, --alpha=ALPHA
                                right ascension of the coordinate system center
                                [degree]
          -d DELTA, --delta=DELTA
                                declination of the coordinate system center [degree]
          -f FILE, --file=FILE  The input file, e.g. 'north.iter.9.v23.group'
          -c COORDINATE, --coordinate=COORDINATE
                                Coordinate system (i.e. equatorial, galactic,
                                supergalactic, cartesian)
          -p PGC, --pgc=PGC     pgc number (optional, specify the plot center)
          -w WIDTH, --width=WIDTH
                                The width of the plot in degrees
          -m VMIN, --Vmin=VMIN  The lower limit on radial velocity
          -x VMAX, --Vmax=VMAX  The upper limit on radial velocity
          -X SGX, --SGX=SGX     SGX center
          -Y SGY, --SGY=SGY     SGY center
          -Z SGZ, --SGZ=SGZ     SGZ center
          -j PROJECTION, --projection=PROJECTION
                                projection type
                                1  - SGX-SGY                       2  - SGX-SGZ
                                3  - SGY-SGZ                       10 - SGY-SGX
                                20 - SGZ-SGX                       30 - SGZ-SGY
          -u XT, --XT=XT        X-axis thickness (Mpc)
          -v YT, --YT=YT        Y-axis thickness (Mpc)
          -t ZT, --ZT=ZT        Z-axis thickness (Mpc)
          -G                    Plot the border of Virgo Cluster
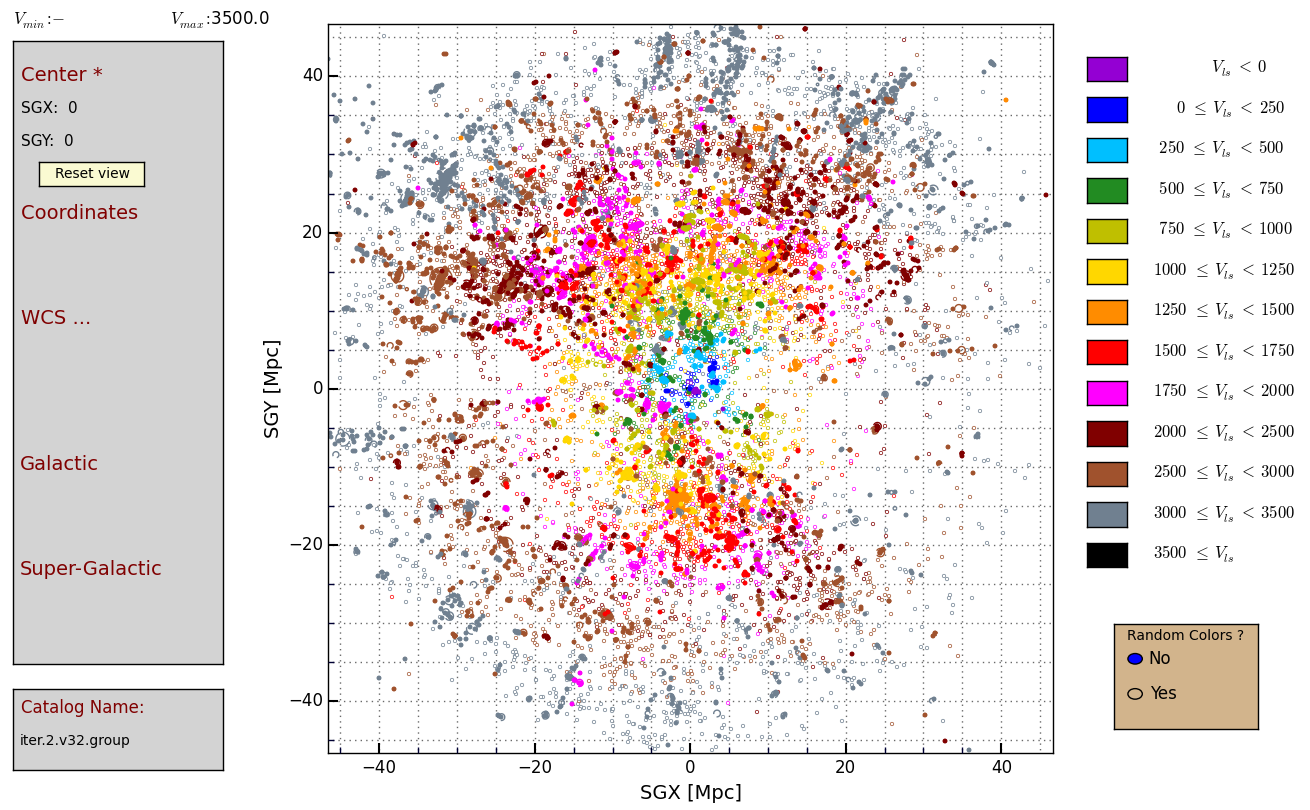
The following diagram is the output of the code for the Virgo cluster, using the following command:
$ python skyplot_group.py -f all.iter.2.v41.group -c supergalactic -a 102 -d -2 w 50
Virgo is the largest group at the center and color-coded in yellow. All groups are color-coded based on their average radial velocities, i.e. V_ls. The legend on the right shows that color code. The box on the left shows the coordinate of the sky where the mouse pointer is. Each point is a galaxy and dashed circles represent the 2D projected border of groups. Clicking on each galaxy prints out information about the galaxy its associated galaxy in the terminal.

-
If you click on the color bars on the left, you can turn on/off the colors.
-
On the horizontal bar above the plot, you can interactively manually enter your desired velocity limits. This feature can also be used with the color bar feature to even have more flexibility. After entering your values, press the set button to see the effect. Press Clear to clear the text cells and enter new values. Press Show all to reset the values (i.e. showing all galaxies, groups).
-
show all and set buttons can be used alternatively to either display all the objects or to go back to the initial velocity setup.
-
You can also enter radial velocity limits on the command line using -m and -x flags. See the following examples to only display galaxy with radial velocities between 1,000 and 2,000 km/s::
$ python skyplot_group.py -f all.iter.2.v41.group -c supergalactic -a 102 -d -2 w 50 -m 1000 -x 2000 -
Use the yellow button in the left box (Reset View) to go back the view that was originally set in the command line
-
Use the middle mouse scroll wheel on the plot for zooming in/out.
-
Use the
yes/nobox in the bottom right corner to change the color scheme. -
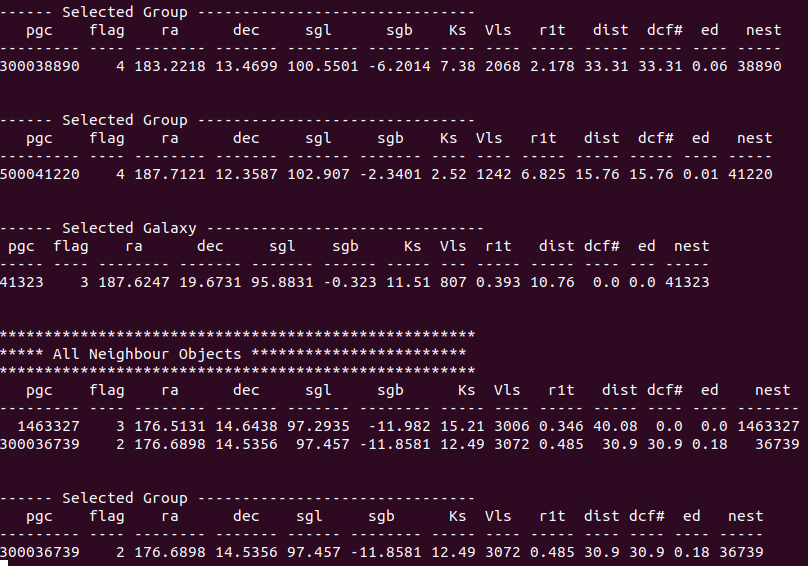
Click on each point (galaxy) to chose it and get some relevant information in the terminal. pgc is the galaxy ID. flag equals 1 for galaxies in a group and 0 for a single galaxy. ra, dec SGL and SGB are the Equatorial and Supergalactic coordinates of the chosen galaxy. Ks is the magnitude, Vls is the radial velocity in km/s, dcf2 is the distance in Mpc, mDist is the average group distance and mDistErr is the uncertainty of the average group distance. nest is the pgc ID of the most luminous galaxy in the group. objname is the galaxy other name.
 9) If the chosen galaxy is in a group, a new window pops out and displays the radial velocity distribution of all group members. See the following example for the velocity distribution of galaxies in the group whose brightest galaxy is PGC 42734. The dashed black line is the average radial velocity and red dotted lines denote the 1-sigma borders. d is the evaluated average distance of the group.

- If you use the -G command flag, you would be able to overplot the 6.8-degree circle around Virgo and also the divider line. Using this flag for other regions does not have any effect. See the following plot.
- Skyplot enables you to make plots in Cartesian coordinates. Skyplot needs to use distances to calculate SGX, SGY, and SGZ, and for most cases, it uses some sort of measured distances. Either galaxies have directly measured distances or they have some associated distances through the group they belong to. If there is no measured distance available, it uses Hubble distances.
You can run skyplot_group and skyplot_supergroup with the appropriate flags to generate plots in SGX-SGY-SGZ coordinates. For example
$ python skyplot_group.py -f all.iter.2.v41.group -c cartesian -x 3500
plots everything up to Vls=3500 km/s in SGX-SGY system by default. Also, you can specify the center of the plot and its size. In the following case -w 15 means 15 Mpc. In this case, the projection is automatically detected to be on an SGX-SGY plane.
$ python skyplot_group.py -f all.iter.2.v41.group -c cartesian --SGX=10 --SGY=15 -w 15
If you specify all tree SGX, SGY and SGZ coordinates of the center, you need to use -j flag to specify your desired projection. This is explained below.
$ python skyplot_group.py -f all.iter.2.v41.group -c cartesian -m 1000 -x 2000 -j 3
The options you can use after -j are as follows:
        1  - SGX-SGY
        2  - SGX-SGZ
        3  - SGY-SGZ

        10 - SGY-SGX
        20 - SGZ-SGX
        30 - SGZ-SGY
Note: You can set either the velocity range or the center of the coordinate system when working in Cartesian coordinates. Using a combination of both is also possible. See this example:
$ python skyplot_group.py -f all.iter.2.v41.group -c cartesian --SGX=10 --SGY=20 -w 15 -m 1000 -x 2000
where, Vmin=1000 km/s and Vmax=2000 km/s, while the center of the coordinate system and its size were specified. 12) You can also set the center and thickness in the line-of-sight of the view. So, for example, if you are looking at an SGX-SGY view with —SGX=0 —SGY=8 -w 16 then maybe you want to look in the SGZ direction centered at -8 and thickness 4. The following command satisfies your conditions
$ python skyplot_group.py -f all.iter.2.v41.group -c cartesian --SGX=0 --SGY=8 -w 16 --SGZ=-8 --ZT=4
When you specify the thickness parameter (--ZT above), you don't need to specify the projection direction. If you happen to specify the projection direction and it's incompatible with the specified projection, it ignores the thickness parameter.
Note: Command line is NOT sensitive to the given order of parameters.
This is the list of all thickness parameters you can use.
        --XT=XT    X-axis thickness (Mpc)
        --YT=YT    Y-axis thickness (Mpc)
        --ZT=ZT    Z-axis thickness (Mpc)
Useful feature: When you are in the Cartesian mode, you can see SGX-SGY-SGZ coordinates of the selected object on the left side of the plot in the coordinate box.
Associations (supergroups) are ensembles of galaxy groups that are within the first turnaround radius of the enclosed mass. For more details on the physical meanings and definitions please refer to Kourkchi and Tully (2017, ApJ, 843, 16): http://adsabs.harvard.edu/abs/2017ApJ...843...16K
-
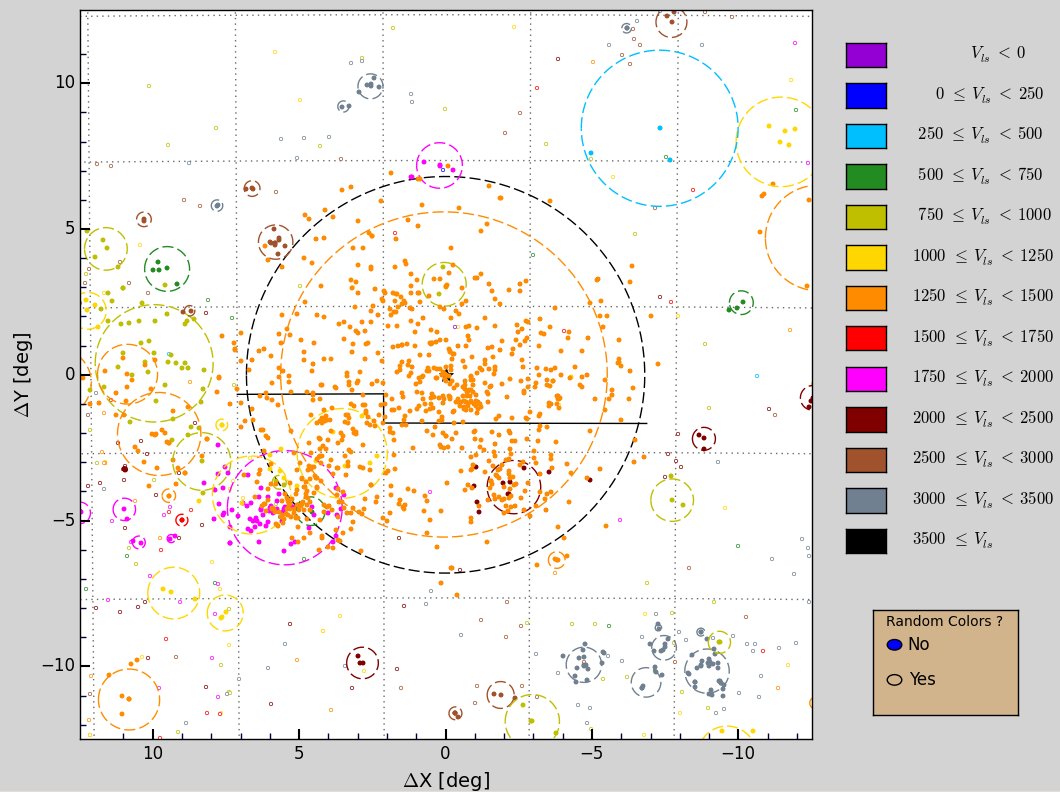
How to run (example). The following diagram is the output of the code for the Virgo cluster, using this command:
$ python skyplot_supergroup.py -f all.iter.2.v41.supergroup -c supergalactic -a 102 -d -2 w 50

In this plot, each point represents a group and the big circles are the halos of galaxy group associations. The radius of each circle is the projected first turnaround radius, of the corresponding halo.
Symbols are:
- Filled points: groups in super-groups
- Open point: groups not in any super-group
- filled boxes: single galaxies associated with a supergroups
- crosses (x): single galaxies not associated with anything
By clicking on each point you can see the group projected radius resented by R2t. For example, in the above plot, the red star shows the center of the Virgo cluster and the dashed red circle is its projected second turnaround radius.
The code uses the following formulation to calculate the first turnaround radii, r1t. It uses the Hubble distance for those groups with no available distance information.
        r2t = sqrt(1.5)*R_2t
        r1t = 3.5*r2t
All other features of skyplot_supergroup.py are very similar to those of skyplot_group.py.
By clicking on each point, you can get some relevant information in the terminal.
Here is the meaning of the numeric flags:
- flag = 5: Super-group head
- flag = 4: group in a supergroup
- flag = 3: single galaxy in a supergroup
- flag = 2: single group NOT in any supergroup
- flag = 0: single galaxy NOT in any group or super-group
This code has been tested using Python 3.7.6. For any later python versions, you may need to modify/adjust a few syntaxes to get all the GUI features to work.
This is the list of the python packages you need.
- Python main packages:
- matplotlib
- numpy
- optparse
- astropy
- Python external packages. These are not available in the PyPi repository and therefore you need to install them manually.
-
kapteyn (get it here: https://www.astro.rug.nl/software/kapteyn/). The latest version for Python 3.x can be installed using pip as follow
pip install https://www.astro.rug.nl/software/kapteyn/kapteyn-3.0.tar.gz
- tkinter: This is the heart of the visualization engine. Find more about it here: https://docs.python.org/3/library/tkinter.html
Note: tkinter might not be installed using pip. So, you may need to install it on your system separately. On Ubuntu, you can use the following command:
sudo apt-get install python3-tk
- - - -
- Credit: Kourkchi and Tully (2017, ApJ, 843, 16), Galaxy Groups Within 3,500 km/s
- Author: Ehsan Kourkchi ekourkchi@gmail.com
- Feel free to distribute and modify for a better performance