Build with ./build.py (needs Java ≥11), run with ./run. Examples below assume grr is linked to ./run.
Simple example uses:
grr some-program # run program in gdb
grr -ld -d main some-program # open to a disassembly of the given function
grr --perf perf.data # view ./perf.data (equivalent to `grr --perf .`)
grr --rr # view latest rr trace
grr --rr some-program-1 # view specific rr trace
Some potential shell aliases:
alias rv="grr --rr" # view last rr run
alias gd="grr -ld -d" # "gd symname ./file" to disassemble given symbol
alias gv="grr -ld -v" # "gv ./file" to view file without running
alias gp="grr --perf ." # view perf.data in this directory
A custom layout can be saved with ctrl+shift+s, and loaded with --layout /path/to/file, or, if saved in path/to/grr/local/<name>.txt, with -l<name>.
Where applicable, holding shift will reverse-execute on rr.
| key | action |
|---|---|
| F1 | Rerun from start |
| F3 | Break |
| F2 | Continue |
| F5 | Step forward one instruction |
| F6 | Step over one instruction |
| F7 | Step forward one line |
| F8 | Step over one line |
| F9 | Run function to completion |
| ctrl+. | Center rr timeline around current position |
| ctrl+shift+s | Save layout |
On breakpoint creation, alt+h toggles hardware, alt+t - temporary, alt+e - enabled.
On watchpoint creation, alt+1/2/4/8 chooses width, alt+r & alt+w toggle read/write.
A simple grr some-program will run the program in gdb. grr some-program foo bar will run the program with the arguments foo & bar.
grr --core path/to/core path/to/program to view a coredump.
grr --perf path/to/perf.data views data recorded by linux perf. grr --perf path/to pointing to a directory will implicitly read a perf.data file within it.
An attempt is made to read /tmp/perf-<pid>.map for JIT symbol ranges (disassembly not included). The file format is the same as that expected by perf report, that is, lines of hexAddress hexLength name - e.g. a line of 12AB E my function represents a function starting at 0x12AB, 14 bytes long, and the name my function.
The last rr recording can be replayed with grr --rr, and a specific recording with grr --rr some-program-123.
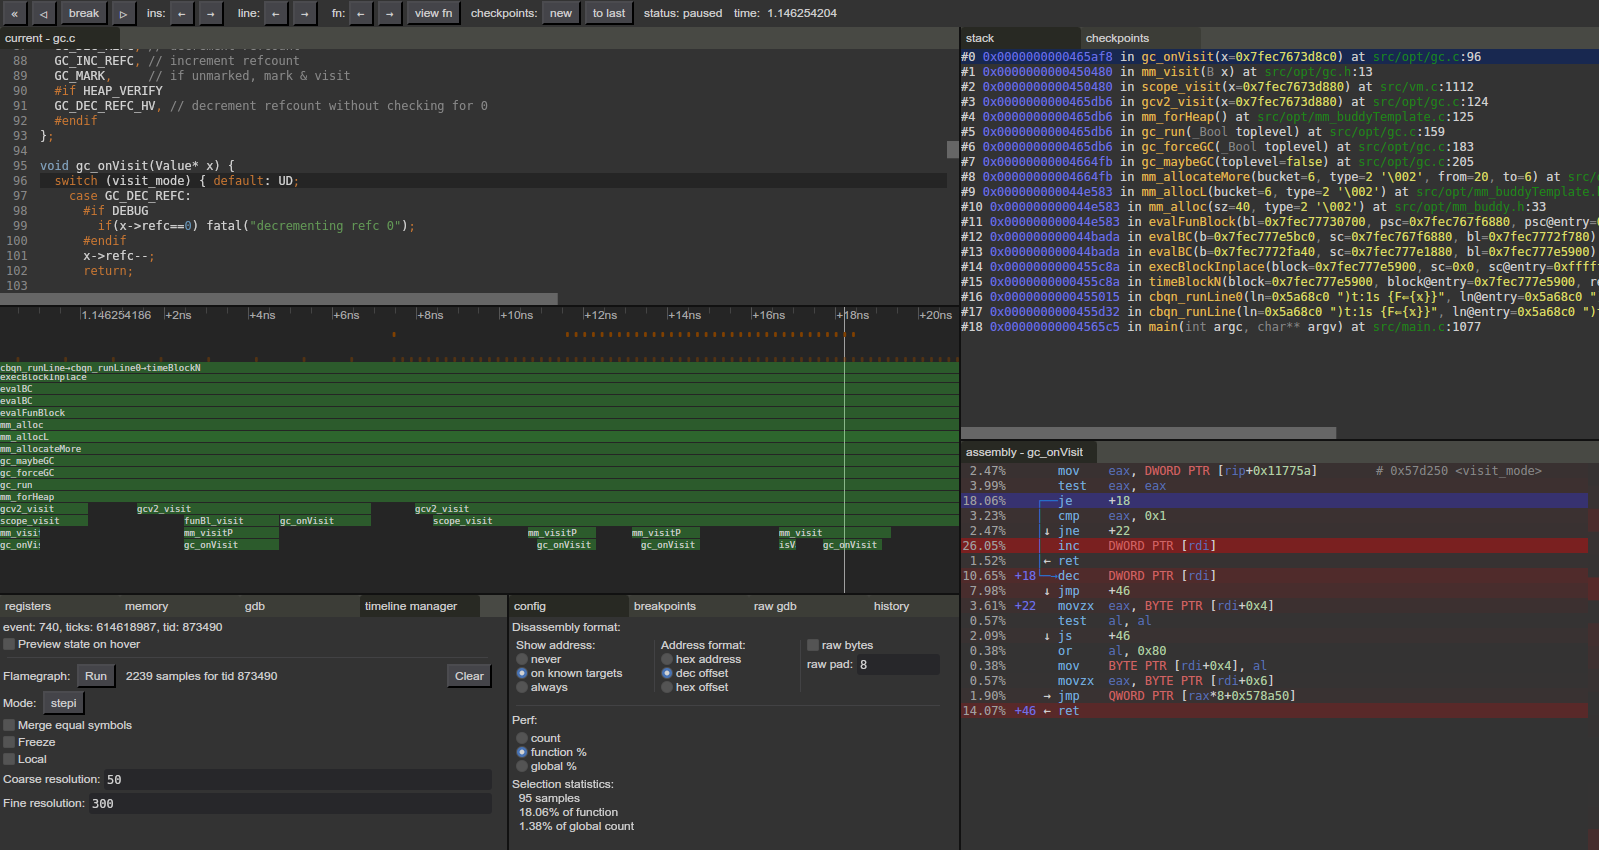
Note that, while the timeline window shows time as seconds, it's actually just interpolating the number of retired conditional branches between the nearest two events (≈ syscall starts/ends) and thus is extremely inaccurate for performance purposes.
The "timeline manager" tab allows sampling stacktraces and building a flamegraph out of that - "ticks" mode will sample in the visible interval spaced at the specified resolutions, "stepi" and "continue" will sample running the specified action from the intial position. It is suggested to start from a position at or after the desired sampling interval, otherwise gdb may not pick up the necessary libraries and fail to symbolize.
While mainline rr works, this fork provides additional features, including precise ordering of instruction-level samples on the timeline, the ability to jump to previously visited locations, and much faster ticks-based sampling.
--rr can be combined with --perf, --cachegrind, and --jvm-out.
/tmp/perf-<pid>.map is also attempted to be read as perf's format for JIT symbols even without --perf.
If recorded as perf record rr record ... (as opposed to rr record ...; perf record rr rerun), JIT symbols will also see perf data.
Register and memory nibbles are colored based on memcheck status (green - fully defined, red - fully undefined, orange - some bits are defined).
# start your program:
valgrind --vgdb-error=0 --vgdb-shadow-registers=yes --vex-iropt-register-updates=allregs-at-each-insn ./your-program
# use --vgdb-error=1 instead to immediately run the program after connecting to it, breaking upon hitting an issue

# connect to it:
grr -x 'target remote | /path/to/vgdb' # i.e. the line printed by valgrind above
# if only one valgrind is running at a given time, the --pid=... can be omitted, allowing reusing the single command across multiple invocationsAs valgrind outputs its results per source file line and not instruction pointer/address, an adjusted binary must be used where debuginfo has been replaced. This is provided by --prep-cachegrind.
A usage sequence may therefore look like:
grr --prep-cachegrind output-executable input-executable # write the modified executable to output-executable
valgrind --tool=cachegrind --cache-sim=yes --branch-sim=yes --cachegrind-out-file=cachegrind-out ./output-executable # run program, output data to cachegrind-out; tweak to needs
grr --cachegrind cachegrind-out input-executable # view results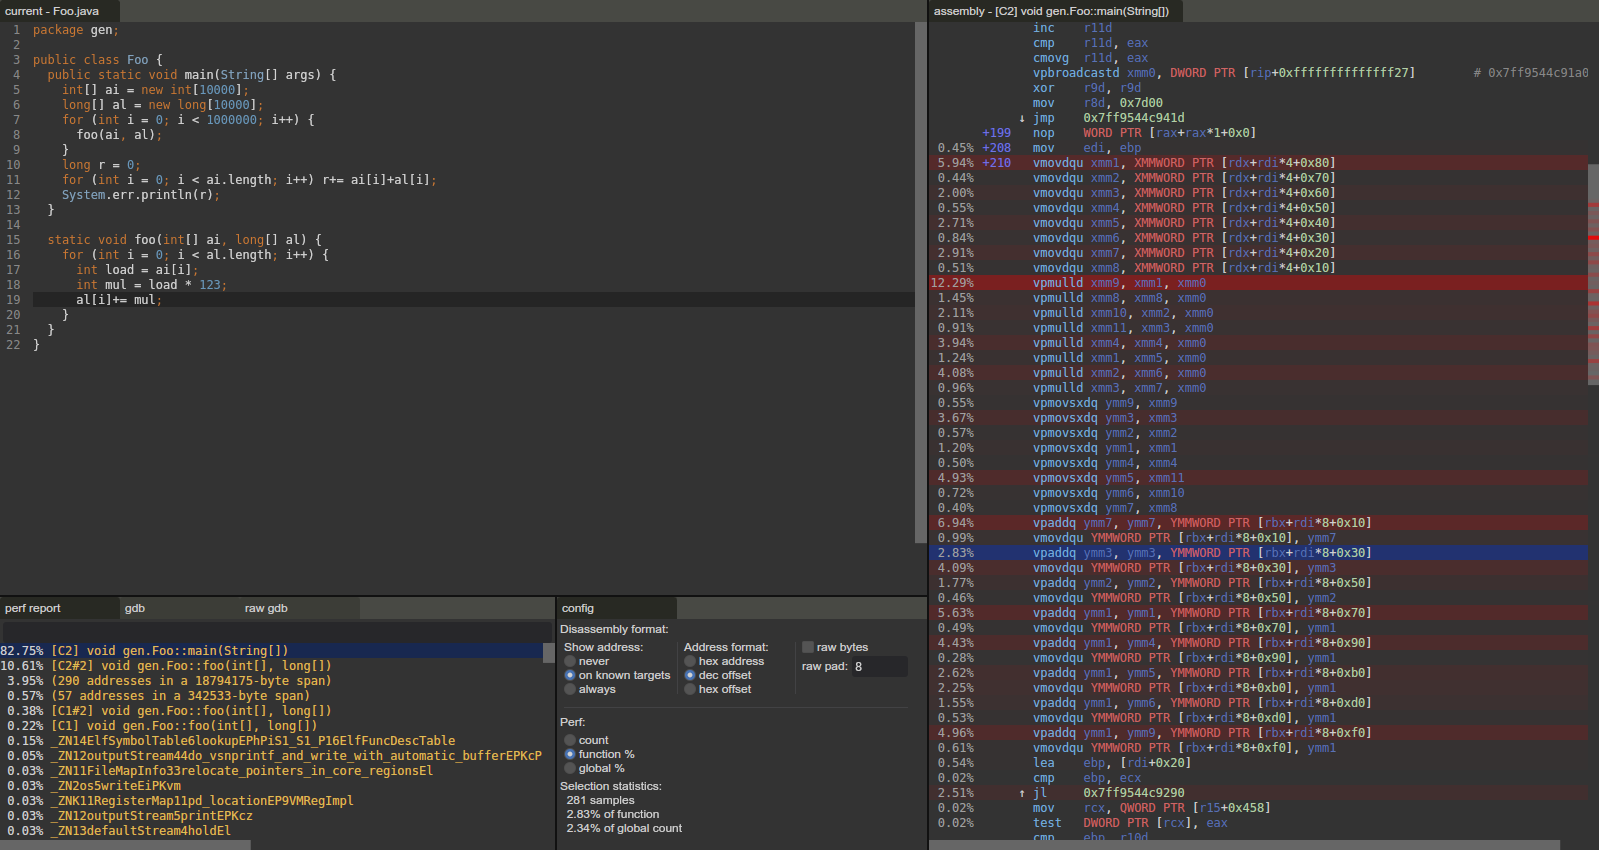
# program must not itself write anything to stdout! (else the output may interleave assembly data printing, and afaict there's no way to redirect it)
perf record java -XX:+UnlockDiagnosticVMOptions -XX:+DumpPerfMapAtExit -XX:+PrintAssembly ... > java-output # record all functions
perf record java -XX:+UnlockDiagnosticVMOptions -XX:+DumpPerfMapAtExit -XX:+DebugNonSafepoints -XX:CompileCommand=print,my.package.Foo::functionName ... > java-output # or record a specific function
# record all functions in my.package.Foo and everything under jdk.incubator.vector with:
#   -XX:CompileCommand=print,my.package.Foo::* -XX:CompileCommand=print,jdk.incubator.vector.*::*
# -XX:+DebugNonSafepoints is implicit for PrintAssembly, but not for CompileCommand (it might help with additional source mapping)

grr --perf . --jvm-out java-output --move /java-src/my/package:path/to/my/package
# the --move remaps my.package.Foo to path/to/my/package/Foo.java (/java-src/ is a hard-coded prefix to differentiate from other paths)
# it can be repeated, or excluded if source mapping isn't desired

# alternatively, just record function names as symbols, without assembly:
perf record java -XX:+UnlockDiagnosticVMOptions -XX:+DumpPerfMapAtExit ...
grr --perf . # plain "perf report" works too

# alternatively, all perf stuff can be left out, and "grr --jvm-out java-output" allows viewing plain disassemblies
Recorded program must be run with Java ≥16 (≥14 with removing -XX:+DumpPerfMapAtExit).
The hsdis plugin must not be installed, as with it OpenJDK disassembles the machine code itself, whereas here the disassembly needs to be done by gdb.
- I/O with the running program is clunky (
--tty inheritmay be preferable). - Not all failure cases are properly handled and may result in Java stacktraces being printed; additionally in some scenarios the connection to GDB/MI "desynchronizes" and will cease functioning until the app is restarted.
- Demangled symbols don't work in some places.