Supplemental Materials for "Comparing Apples and Oranges: Taxonomy and Design of Pairwise Comparisons within Tabular Data"
Supplemental Materials for Section 3 (Taxonomy)
Supplemental Materials for Section 4 (Interface)
- Final Prototype + Video (Sloppy Rules)
- First Prototype (GUI)
- Second Prototype (GUI)
- Logistic Regression Models for Classifying Attributes
Supplemental Materials for Section 5 (User Study)
- Study Materials (Tasks, Questionnaire...)
- Tutorial Videos
- Natural Language Interface Used in the Study
- Sloppy Rule Interface Used in the Study
- Natural Language Queries Entered by the Participants
- Data Analysis Scripts
Here is the codebook that contains the definitions of codes: Link
Here are the scenarios for soliciting pairwise comparison questions from crowd workers: Link
Here is the folder that contain the codes assigned for the four dimensions: Link
Here are the summary statistics and distributions of the codes: Link
Video introducing various aspects of the interface: Link
Final prototype (only tested in Chrome): Link
The system provides the sloppy rule menu that allows users to specify pairwise comparison rules using the sloppy syntax.
First prototype (only tested in Chrome): Link
This version allows users to specify pairwise comparison rules using point and click. The menu only allows users to enter base rules.
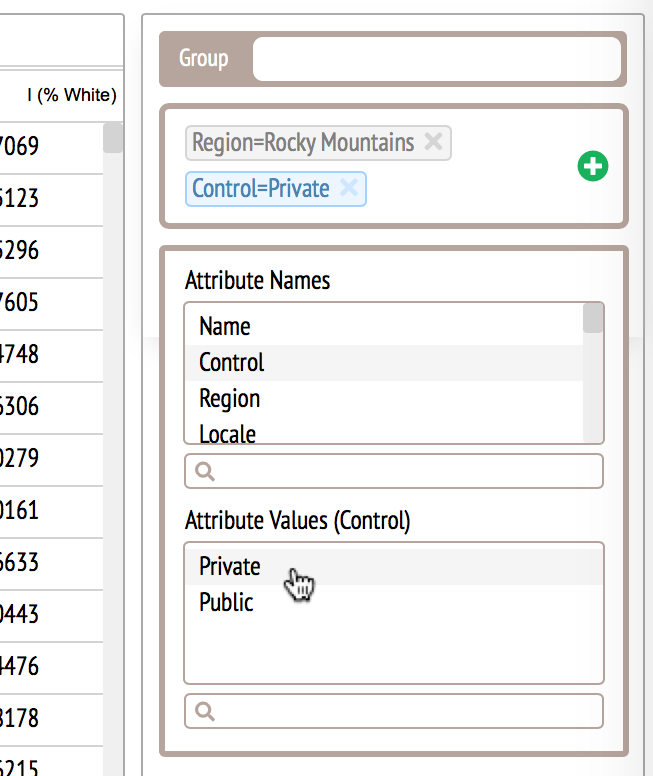
To enter inclusion and exclusion rules, users are required to use the edit button to open an editor. The complexity of the interface caused confusion to the participants in an informal usability study.
Second prototype (only tested in Chrome): Link
This version again allows users to specify pairwise comparison rules using point and click but this time, users can directly enter base rules, inclusion rules and exclusion rules using the menu.
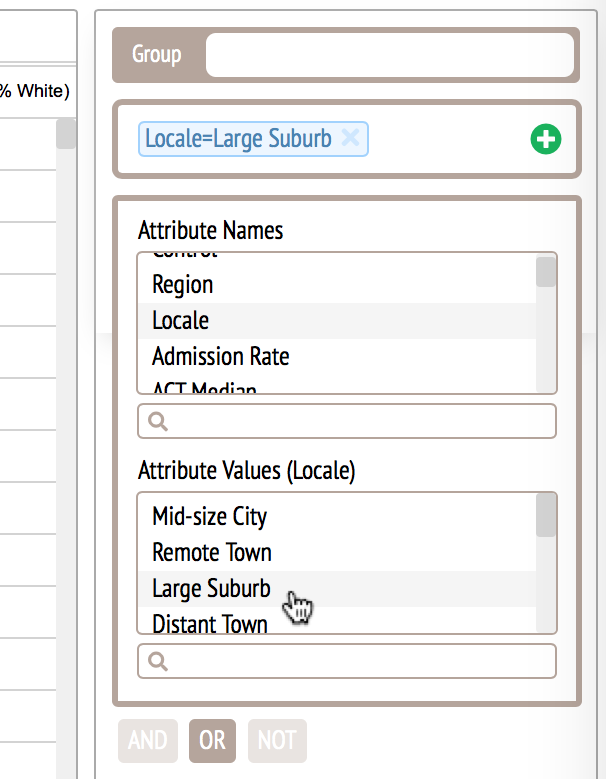
We compared this interface with the natural language interface in an informal usability study and the participant commented that the GUI helped "articulating" and "think about" pairwise comparison questions but the interface was still too complicated -- the interface complexity counteracted with the ease of articulation. This finding impelled us to improve the design and eventually resulted in the sloppy rules.
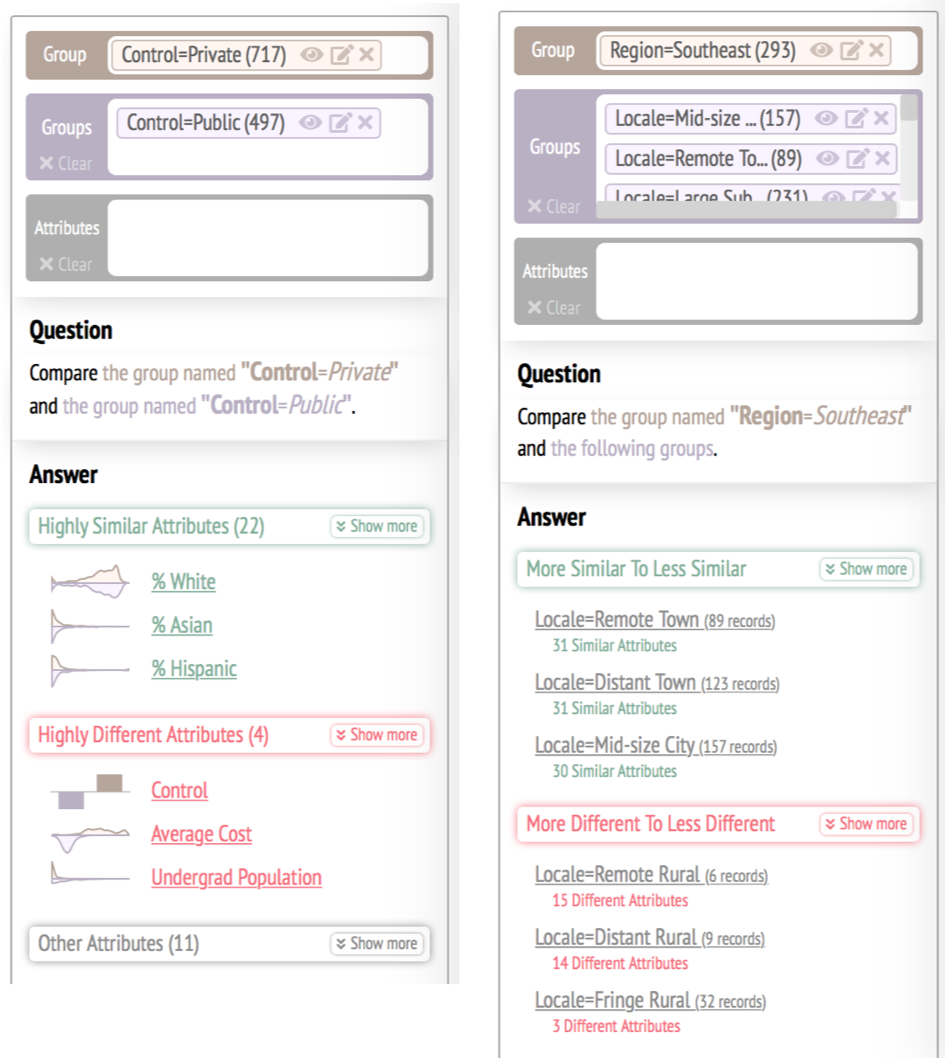
For "single" comparisons, the system classifies attributes into highly similar attributes, highly different attributes and other attributes. For "repeated" comparisons, the system sorts the groups based on their number of similar and different attributes. The attributes are classified using logistic regression models.
Here is a description of the logistic regression models: Link
Here is a folder that contains the training data: Link
Here is the study material folder: Link
To reduce learning effect, the presentation order of the two interfaces were counterbalanced. The following were the steps the participants followed for a participant who uses the natural language interface first:
- Fill out the consent form (not in the study material folder)
- Read the sample tasks
- Watch a video about the visual language
- Watch a video about the natural language interface
- Read the attributes in the car dataset used in the practice tasks
- Perform three practice tasks using the sloppy rule interface
- Read the attributes in the college dataset used in the test tasks
- Perform four test tasks (set 1) using the sloppy rule interface
- Watch a video about the sloppy rule interface
- Read the attributes in the car dataset used in the practice tasks
- Perform three practice tasks using the sloppy rule interface
- Read the attributes in the college dataset used in the test tasks
- Perform four test tasks (set 2) using the sloppy rule interface
- Fill out the questionnaire
- Being interviewed on the relative pros and cons of the interfaces
Video introducing the visual language: Link
Video introducing the natural language interface: Link
Video introducing the sloppy rule interface: Link
Natural language interface for the study (only tested in Chrome, may take around one minute to load): Link
Code of the natural language interface (need Flask and Python 3 to run the server): Link
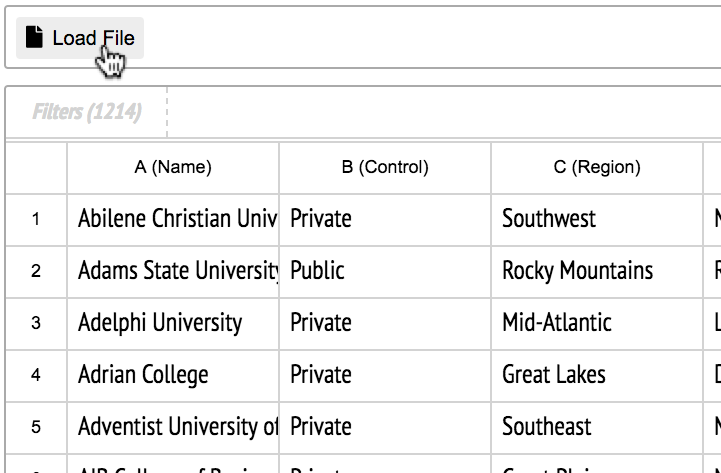
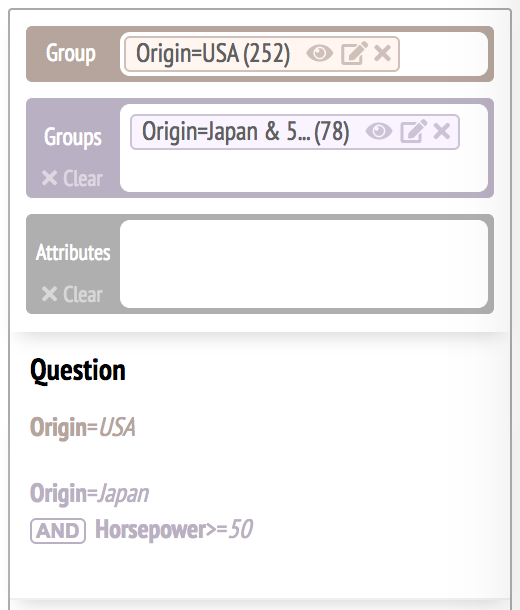
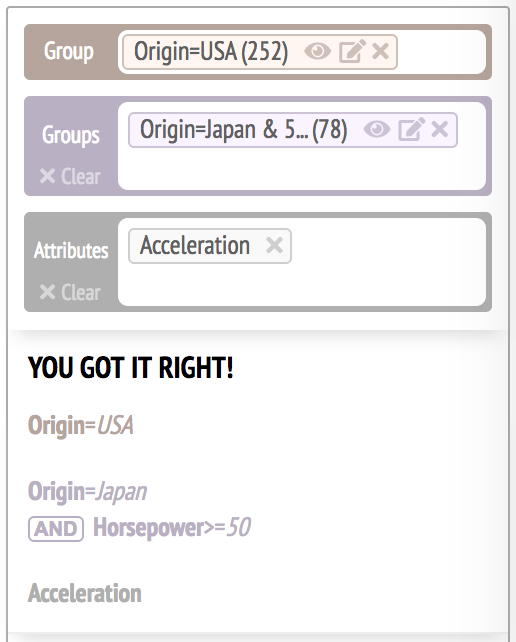
Here, we describe how the natural language interface was used during the user study. Let's suppose a participant is working with the practice tasks. At the beginning, the experimenter loads "oneToOnePractice.csv" using the load button in the interface. The data have to be loaded for the system to classify queries correctly.
The participant then start working on the three practice tasks using the natural language interface. The following is the first practice task.
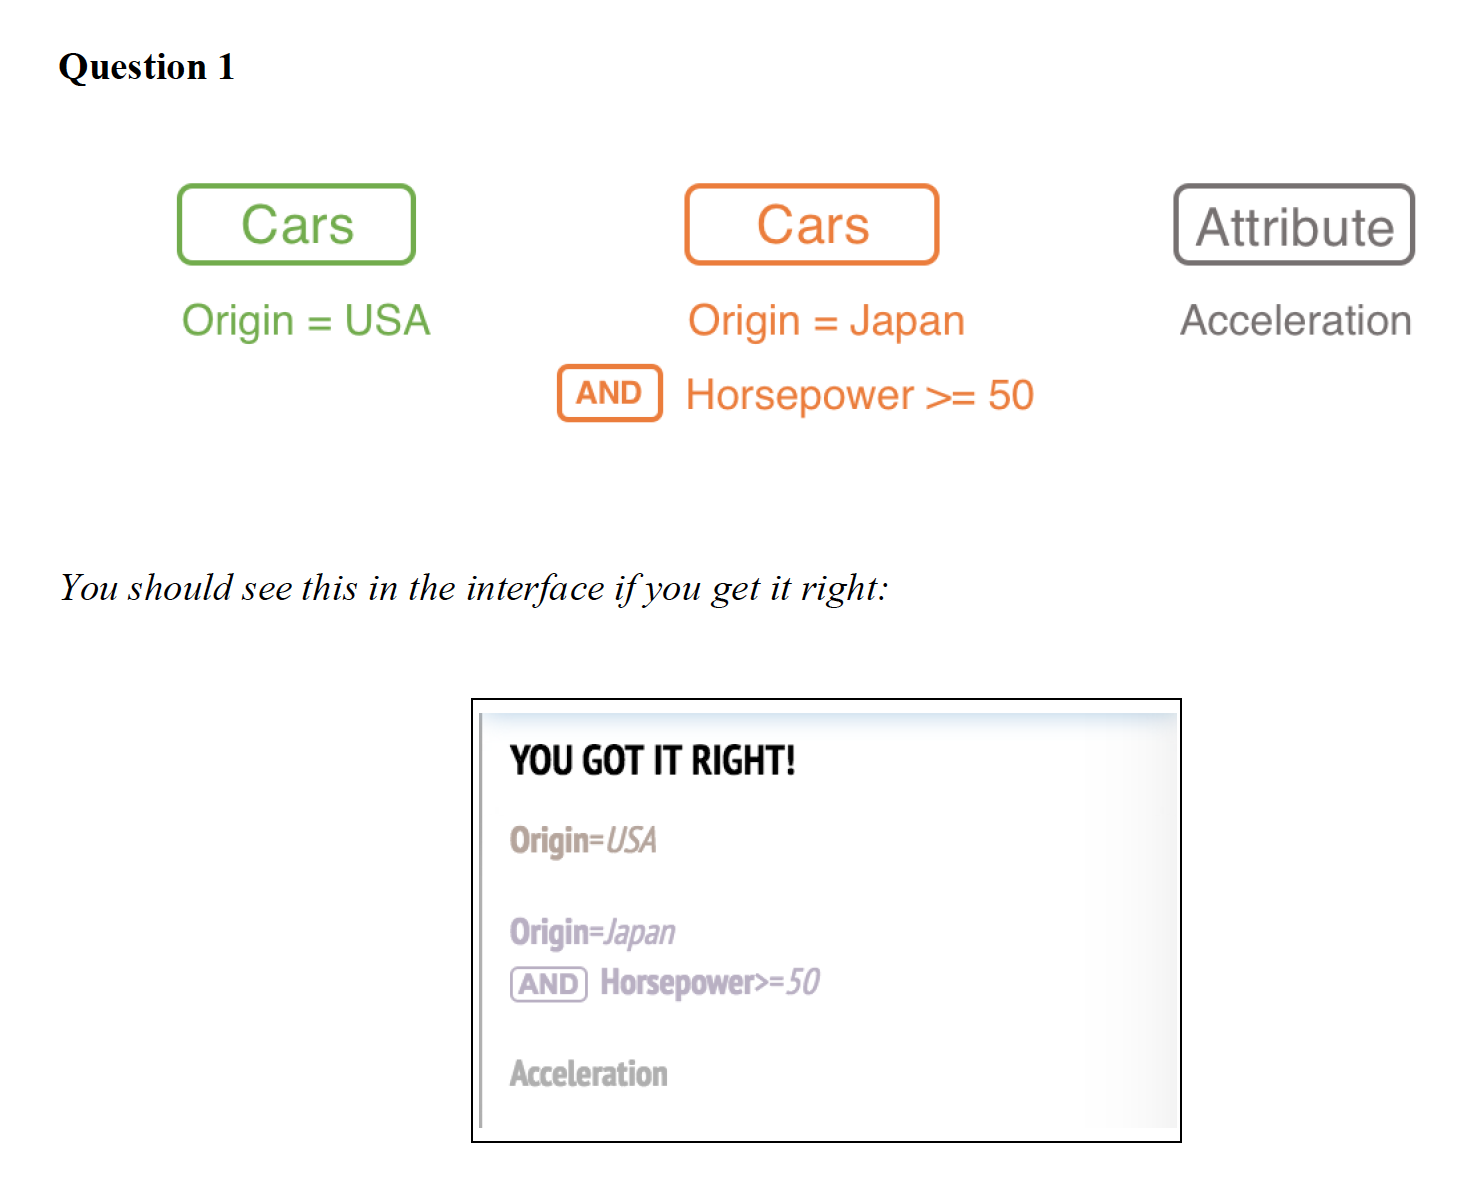
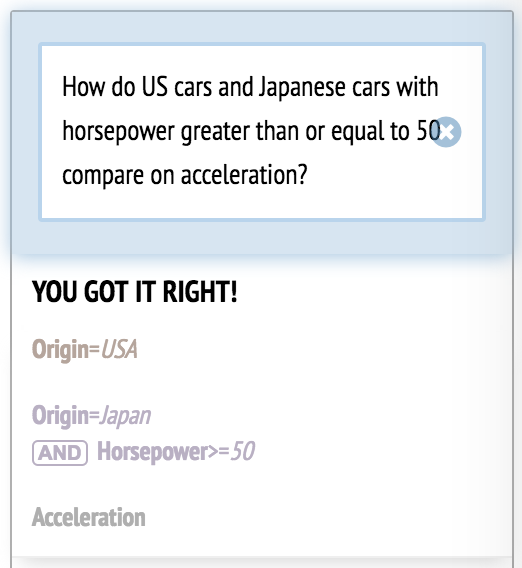
If the query is correct, the system displays "YOU GOT IT RIGHT!"
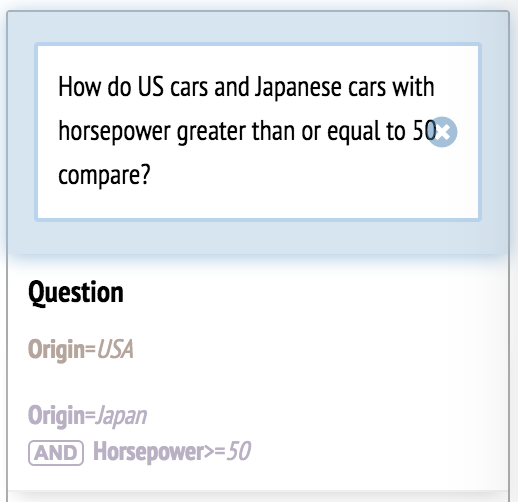
If something are missing from the query, the system shows its interpretation to the participant so the participant can correct themselves.
Similarly, if a participant works on test tasks (set 1) using the natural language interface, the experimenter first loads "oneToOneSetOne.csv". When a participant works on test tasks (set 2) using the natural language interface, the experimenter first loads "oneToOneSetTwo.csv".
Although the natural language interface is highly limited, it serves the purpose of the user study.
Sloppy rule interface for the study (only tested in Chrome): Link
Code of the sloppy rule interface: Link
The sloppy rule interface was modified to show its interpretation of a query as participants enter pairwise comparison rules.
It also displays "YOU GOT IT RIGHT!" if a query is correct.
While the participants were using the natural language interface, they were presented with either test tasks (set 1) or test tasks (set 2). They were asked to translate the visual language into an English sentence.
Here are the queries entered by the participants: Link
Here is the folder that contains the data analysis scripts: Link
There are three dependent measures in the user study:
- Completion Time
Two-way repeated measures ANOVA was conducted to test for interaction between of interface and level of difficulty in predicting completion time. Post-hoc Wilcoxon signed-rank tests were conducted to test whether the time differences between the sloppy rule condition and natural language condition were significant across different level of difficulties.
- Ease of Specification
This dependent variable corresponds to Q1 in "Task-Related Survey" of the questionnaire: "Which interface made it easier to articulate the above visual language (in other words, which interface made it easier to specify the above pairwise comparison questions)?"
We computed the Spearman correlation between the rating and level of difficulty. Sign tests were used to test whether the rating is significantly different from 4 (neutral) for each level of difficulty.
- Preference
This dependent variable corresponds to Q2 in "Task-Related Survey" of the questionnaire: "Which interface would you prefer to perform the above tasks?"
Binomial tests were conducted to test whether the number of participants who preferred sloppy rules is significantly greater than the number of participants who preferred natural language for each level of difficulty.