This project was created by Karolina Dubiel for Impact Hacks '23 (11/10 - 11/12)
Submission Track: Healthy People & Planet SDG 11: Sustainable Cities and Communities & 15: Life on Land
Submitted to Challenge: Umi Feeds Challenge
Submission type: Interdisciplinary (paper + tech solution)
Submission paper: www.karolina.mgdubiel.com/particle/paper.pdf
Demo video: https://www.youtube.com/watch?v=ej3Tu_2-pnk
This submission takes on a novel "square zero" approach to the idea of creating city green space:
we can't create effective green space unless both the public and businesses understand the dire need for their creation.
Aside from the negative impact on the mental and physical health of citizens, one of the top consequences of lack of green space is increased particle pollution. As particle pollution isn't usually visible to humans, it's easy to pretend that it doesn't exist, and therefore, enables citizens to ignore the problem or be less inclined to support public policy initiatives to create more green space.
View demo video here -- https://www.youtube.com/watch?v=ej3Tu_2-pnk
As we stand on the brink of technological innovation, we’re in the midst of a climate crisis. Invisible to the naked eye, particle pollution goes unnoticed by many. This solution is here to change that.
Now, more than ever, we need to rally behind initiatives that improve air quality – like creating green spaces. These green oases are not just luxuries; they're necessities.
Based on studies by the National Library of Medicine, there’s a direct correlation between the amount of green space in an area and particle pollution, as well as citizen health. By encouraging people to vote for the creation of green spaces, we’re saving lives.
But there’s a problem.
Particle pollution is largely invisible, allowing voters and influential businesses to ignore its effects on the health and wellness of a population.
In order to feel that they need to act, citizens need to realize how severe particle pollution is, and how influential green spaces are in filtering our air.
My goal for this policy solution is to require all .gov domains representing municipalities to have a link to a particle pollution visualization tool on their website.
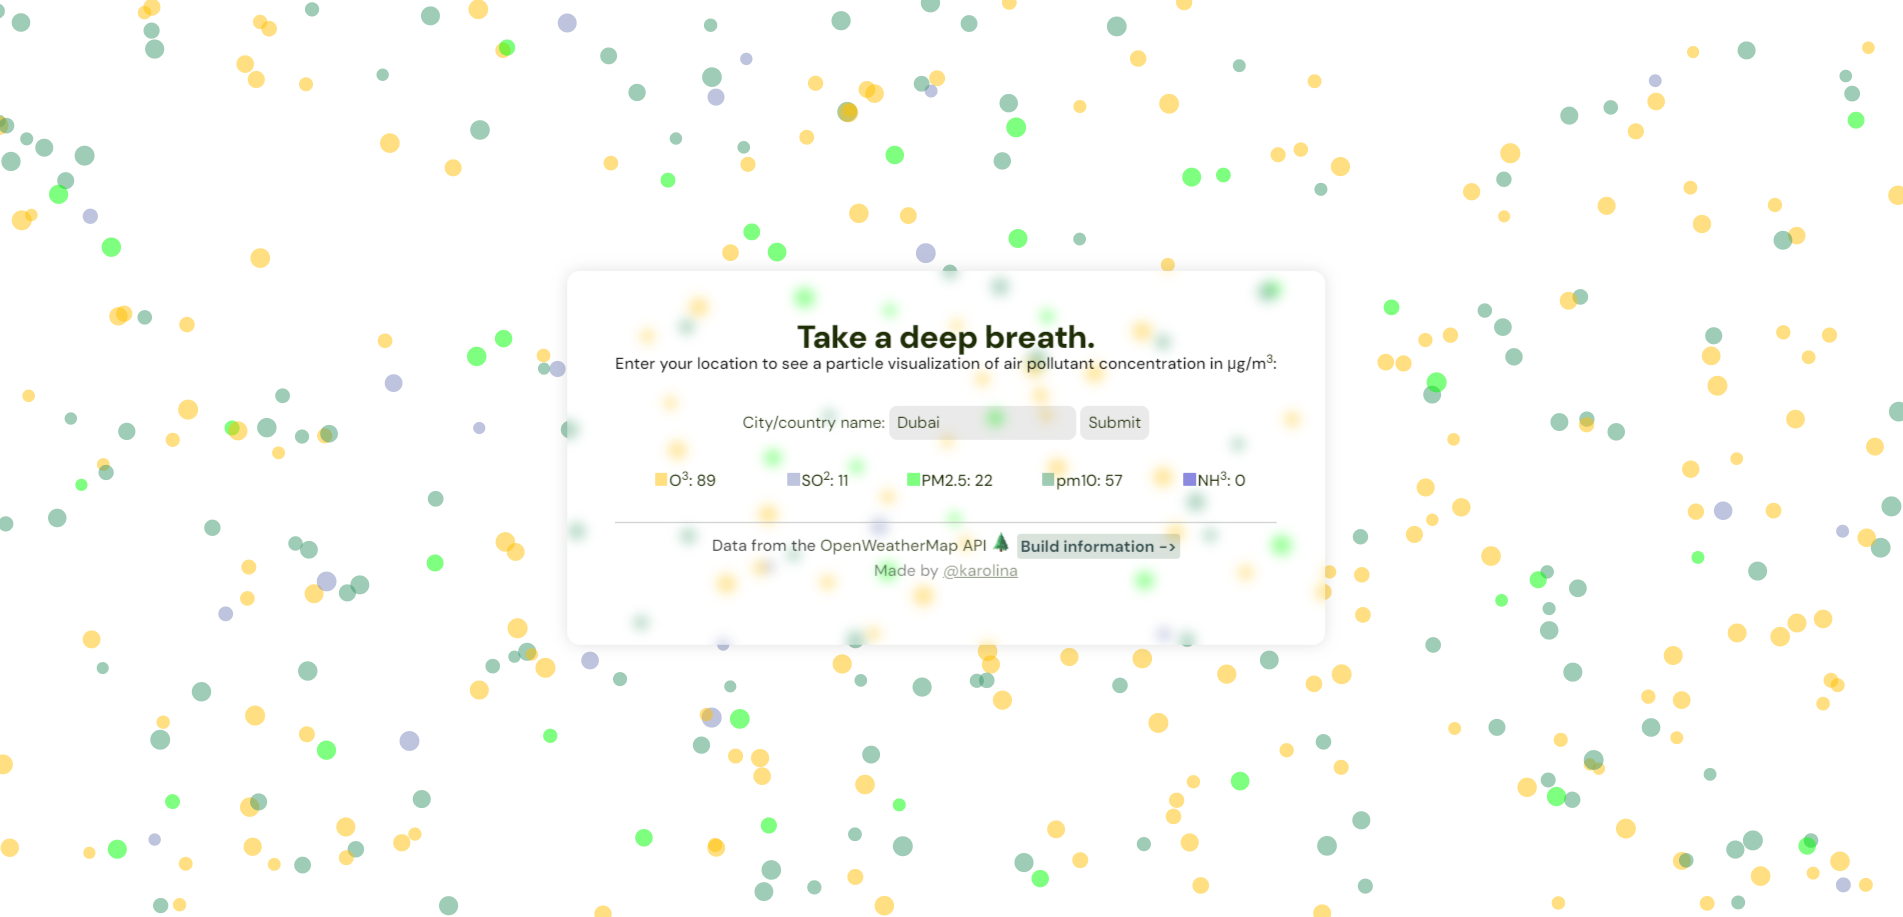
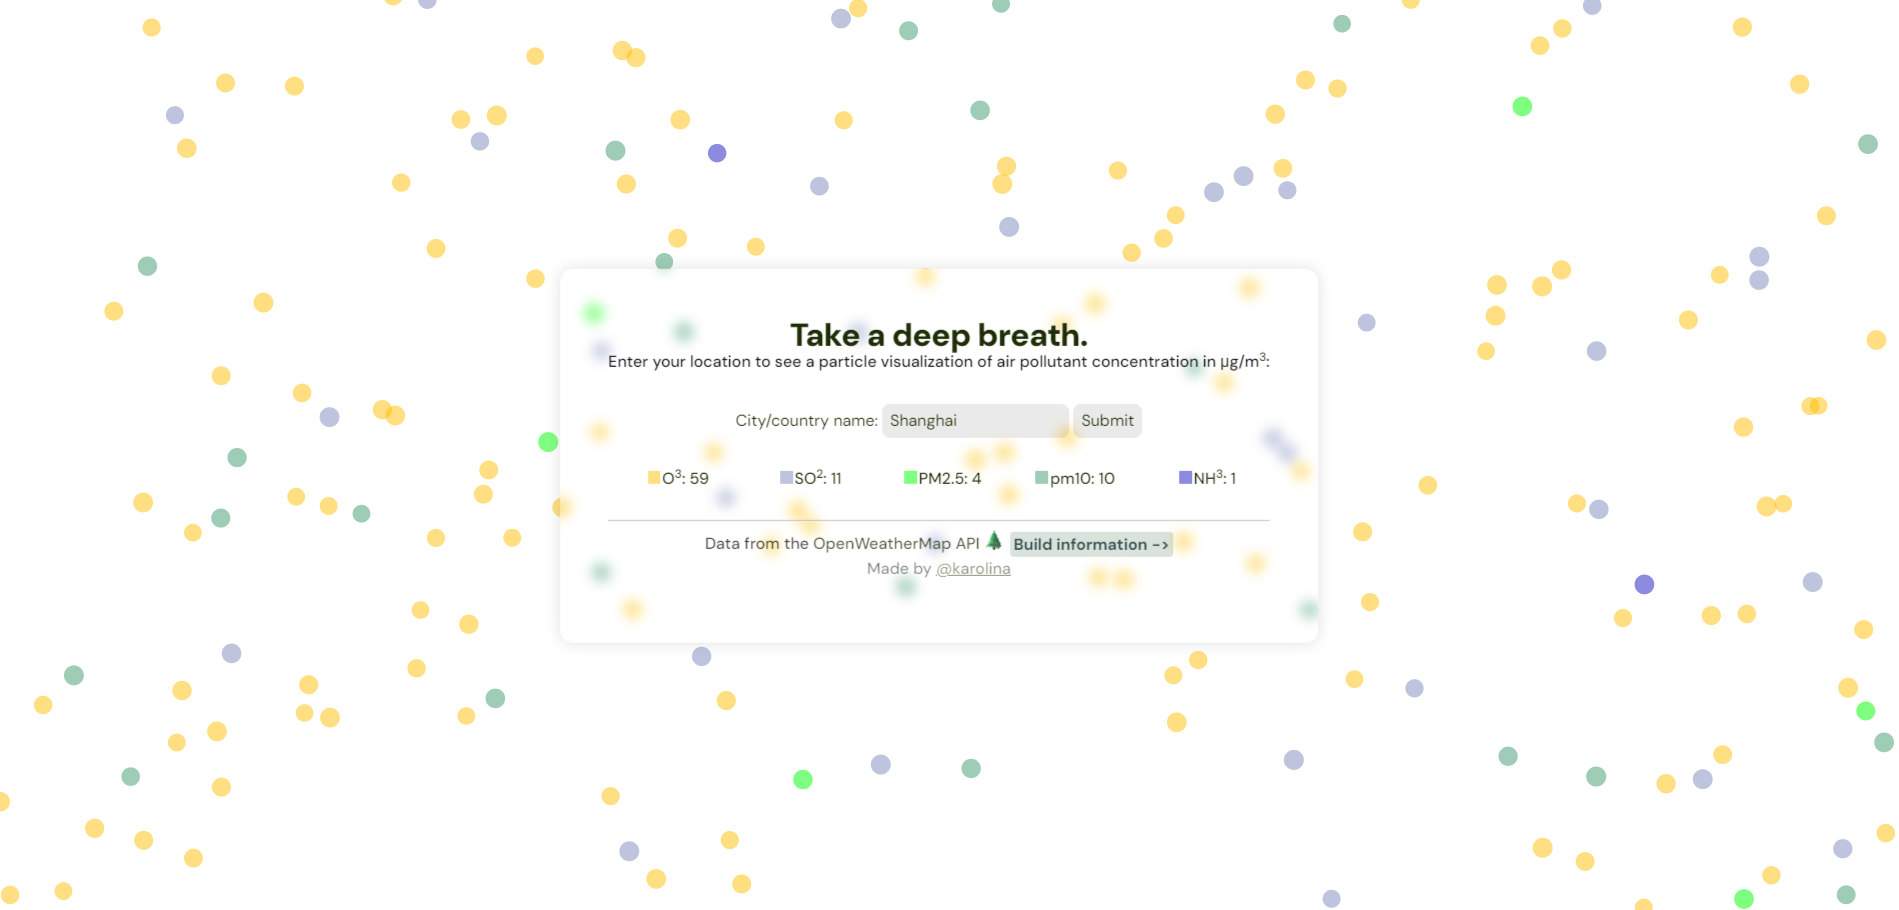
In order to support this, I’ve put together a web tool that makes the invisible visible and interactive. Users can type in the names of various cities and view an interactive particle display showing a cubic meter of air, and air pollution in micrograms divided based on 5 color-coded particulates: ozone, sulfur dioxide, PM 2.5, PM10, and ammonia. Pollution data is live and based on the OpenWeatherMap API.
This web app is available for a live demo on both mobile and desktop devices at www.karolina.mgdubiel.com/particle.
Upon clicking on the Build Information tab, you can view how the technical part of the submission was made, as well as accessing a link to this video and to the adjacent policy paper. A summary of the background information on particle pollution is also available, as well as technical specifications. This project was made in pure Javascript using the particle.js library.
In the future, I'd like to add on a OpenAI API that uses past AQI data to generate a particle animation for what air quality in a given area might be like in the future based on current trends.
Information via epa.gov:
O3: Ozone is both natural and man-made and has both beneficial and adverse affects on human health. In the atmosphere, it shields humans from harmful UV exposure, but when inhaled, it undergoes dangerous chemical reactions with molecules in the respiratory tract.
SO2: sulfur dioxide is primarily emitted through fossil fuel combustion. Increased sulfur dioxide concentration leads to increase particulate matter (PM) pollution.
PM2.5: PM2.5 refers to a class of ultra-fine particulate pollutants, with diameters under 2.5 micrometers.
PM10: PM10 refers to a class of ultra-fine particulate pollutants, with diameters under 10 micrometers.
NH3: Ammonia is a toxicant that typically arises from waste. Large amounts of ammonia can lead to decreased respiratory function, reduction of Na+ to potentially fatal levels, and disruption of blood vessels.
Cities with the most green spaces strongly overlap with cities with lowest particle pollution (data from tpl.org):
both of these cities top global green space statistics, with close to or over 50% of parks and gardens being public green space.


both of these cities have less than 2% public green space, and much higher pollution rates than Singapore and Zurich, despite having lower population densities than Singapore and Zurich, respectively.
This project was primarily built using the Particle.JS library by Vincent Garreau and the OpenWeatherMapAPI.
-
Upon the click of "Submit", the program makes a query through the Geocoder API to translate city name into coordinates.
http://api.openweathermap.org/geo/1.0/direct?q=${cityName}&limit=1&appid=${apiKey}* Once coordinates are fetched, a separate request is made for each of the 5 pollutant quantities at the given coordinates:https://api.openweathermap.org/data/2.5/air_pollution?lat=${latitude}&lon=${longitude}&appid=${apiKey}* From this data, theupdateParticleLabel()loads the number of each particle present in 1 cubic meter of air. -
The
generateColorArraymethod is called. This method creates an array of 50 hex codes, each corresponding to one of the 5 colors representing particle pollutants. -
Using the total number of particles, the percent of each particle out of the total pollutants is determined and rounded to the nearest integer. Based on this data, the array is populated so that the percent of each element determines the number of elements with the corresponding hex code (for example, if pm2.5 is 4% of total pollution, 2 elements will have the pm2.5 hex value).
*Particle.JS doesn't inherently support being able to load x particles of x color (particle colors can be randomly chosen from an array, however, it's not possible to load, for example, 3 green particles and 4 red particles.) For this reason, while the particles on-screen are mostly accurate (in terms of ratio) to the numbers shown in the label, they don't exactly reflect this value. The workaround used was populating an array that reflected the percentage of each pollutant so that "randomly" chosen values would reflect desired percentages as closely as possible.