Resources for Maptime MileHigh PostGIS Meetup
First download the source data here:
https://github.com/dpsspatial/Maptime/raw/master/maptime_postgis_data.zip
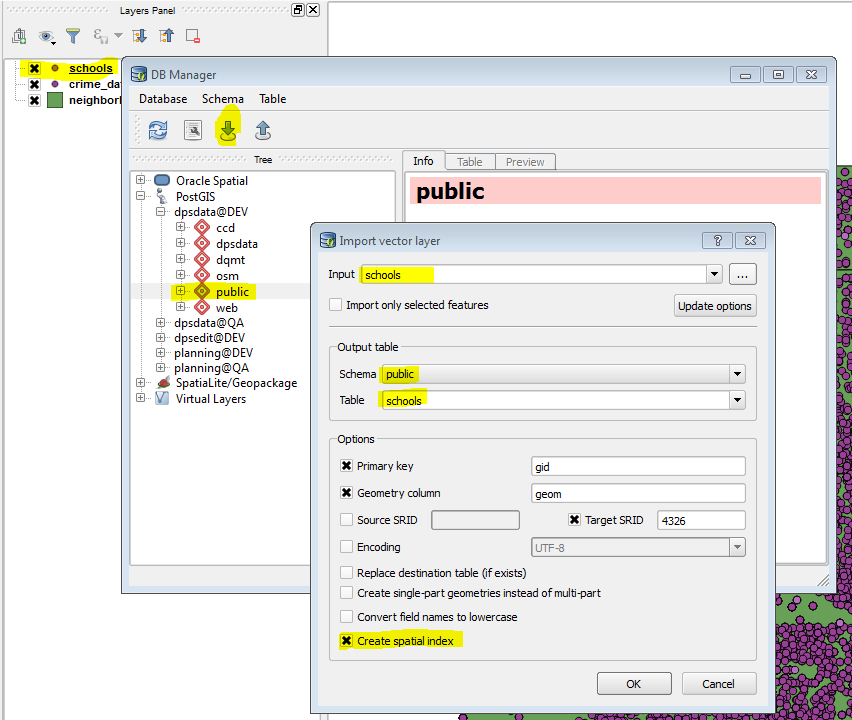
Then use the QGIS DB Manager to import each of the files.
The first task is to count the crimes by type from the crime table
select * from (
	select
	crime_type
	, count(*) as count
	from maptime.crime
	group by crime_type
) as counts
order by counts.count desc
Then we can spatially intersect the crimes with the neighborhoods so we can count the crimes by neighborhood:
select
counts.nbhd_id
, counts.count
, h.geom

from (
	select
	h.nbhd_id
	, count(*) as count
	from maptime.crime as c
	join maptime.neighborhoods as h on ST_Intersects(c.geom, h.geom)
	group by h.nbhd_id

) as counts

join maptime.neighborhoods as h on counts.nbhd_id = h.nbhd_id
And the last exercise was to create a list of schools with the highest number of 'liquor-posession' crimes within a 1/2 mile of the school:
select
s.name
, data.count
from (
	select
	count.orig_fid
	, count(*) as count
	from (
		select
		s.orig_fid
		 from maptime.schools as s
		join maptime.crime as c
		on ST_DWithin(ST_Transform(c.geom, 2877), ST_Transform(s.geom, 2877), 2640)
		where c.crime_type = 'liquor-possession'
	) as count --alias subquery doing the counting
	group by count.orig_fid
) as data --alias subquery so we can order the counts and add the school information, including geometry if needed!
join maptime.schools as s on data.orig_fid = s.orig_fid

order by data.count desc