Skip to content
View dianaow's full-sized avatar
🐱
🐱
Block or Report

Block or report dianaow

Block user

Prevent this user from interacting with your repositories and sending you notifications. Learn more about blocking users.

You must be logged in to block users.

Please don't include any personal information such as legal names or email addresses. Maximum 100 characters, markdown supported. This note will be visible to only you.
Report abuse

Contact GitHub support about this user’s behavior. Learn more about reporting abuse.

Report abuse
dianaow/README.md

Hi there 👋

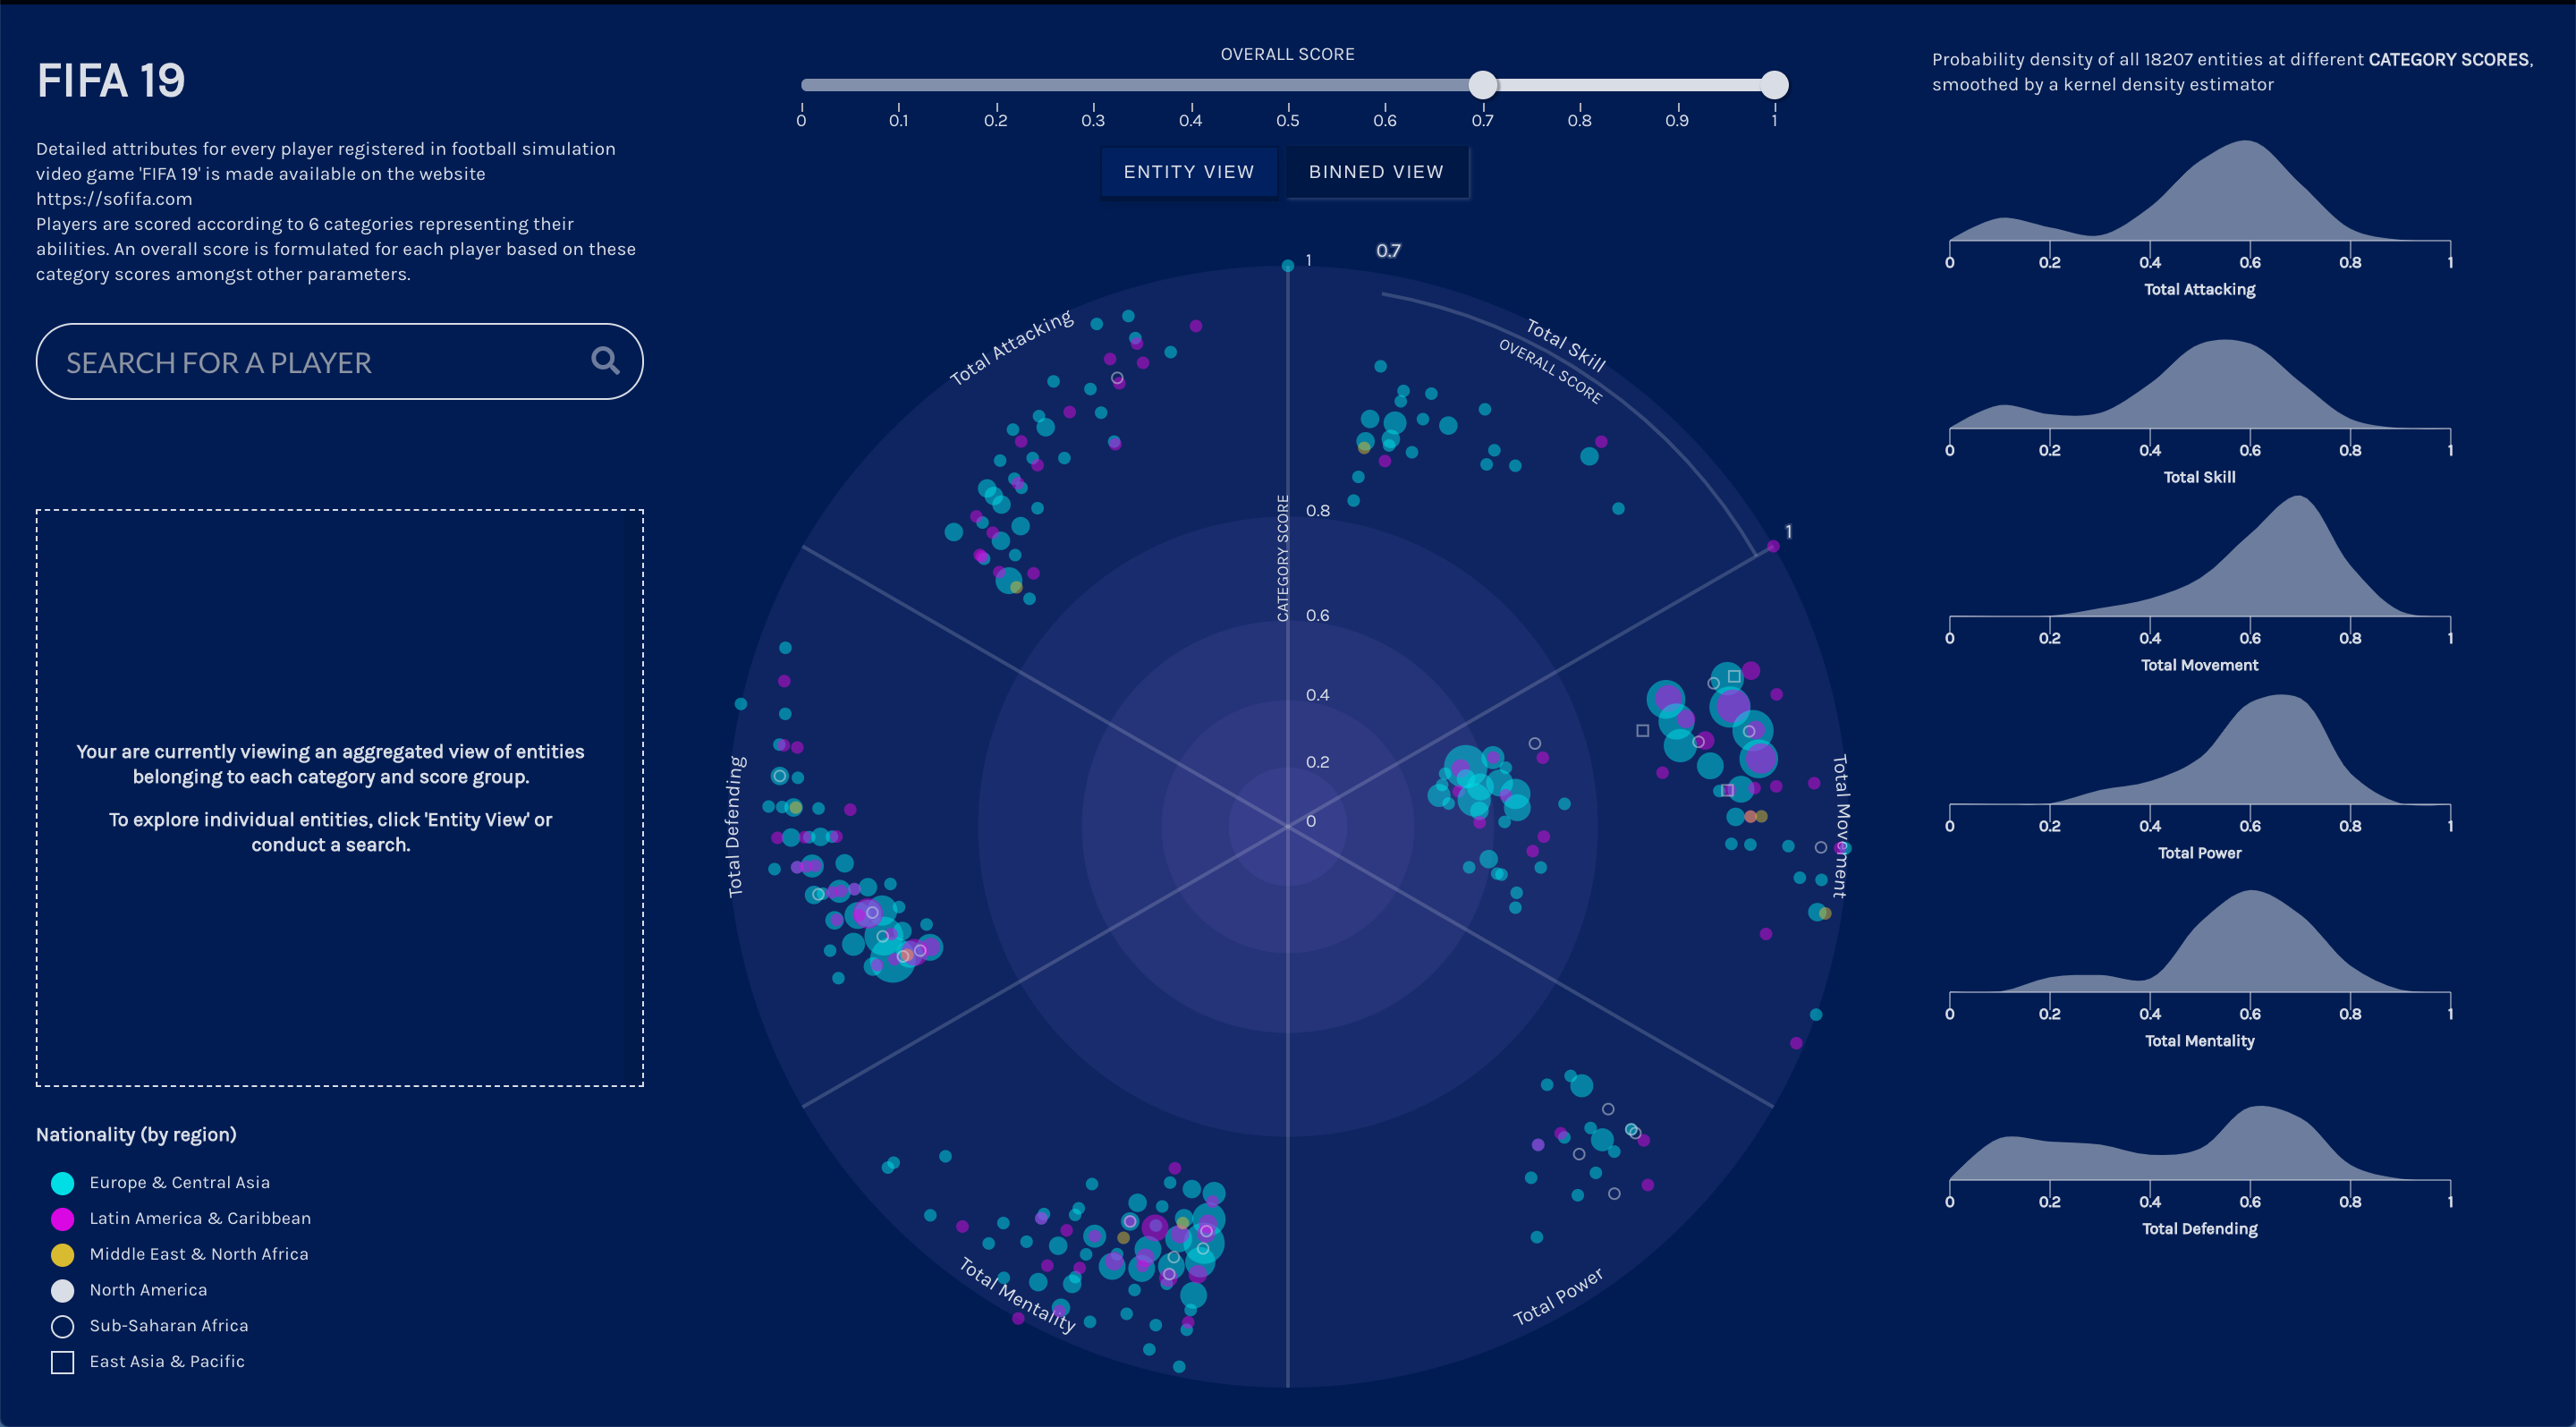
I am a Frontend Developer, with close to 5 years of experience building data-rich web applications, data visualizations and creative visual interfaces. I design and develop detailed and interactive visualizations with D3.js, PIXI.js, Canvas, React, Svelte, Javascript (ES6+) and CSS, as seen on my portfolio - dianaow.com

I have a particular interest and specialization in relationship mapping with network or graph visualization. I also enjoy creating generative art!

Contact me at diana.ow[at]outlook[dot]com

Pinned

  1. flask-react-d3-celery flask-react-d3-celery Public

    A full-stack dockerized web application to visualize Formula 1 race statistics from 2016 to present, with a Python Flask server and a React front-end with d3.js as data visualization tool.

    JavaScript 40 7

  2. d3-network-time d3-network-time Public

    d3 plugin to create a temporal network visualization

    JavaScript 16 3

  3. singapore_stories singapore_stories Public

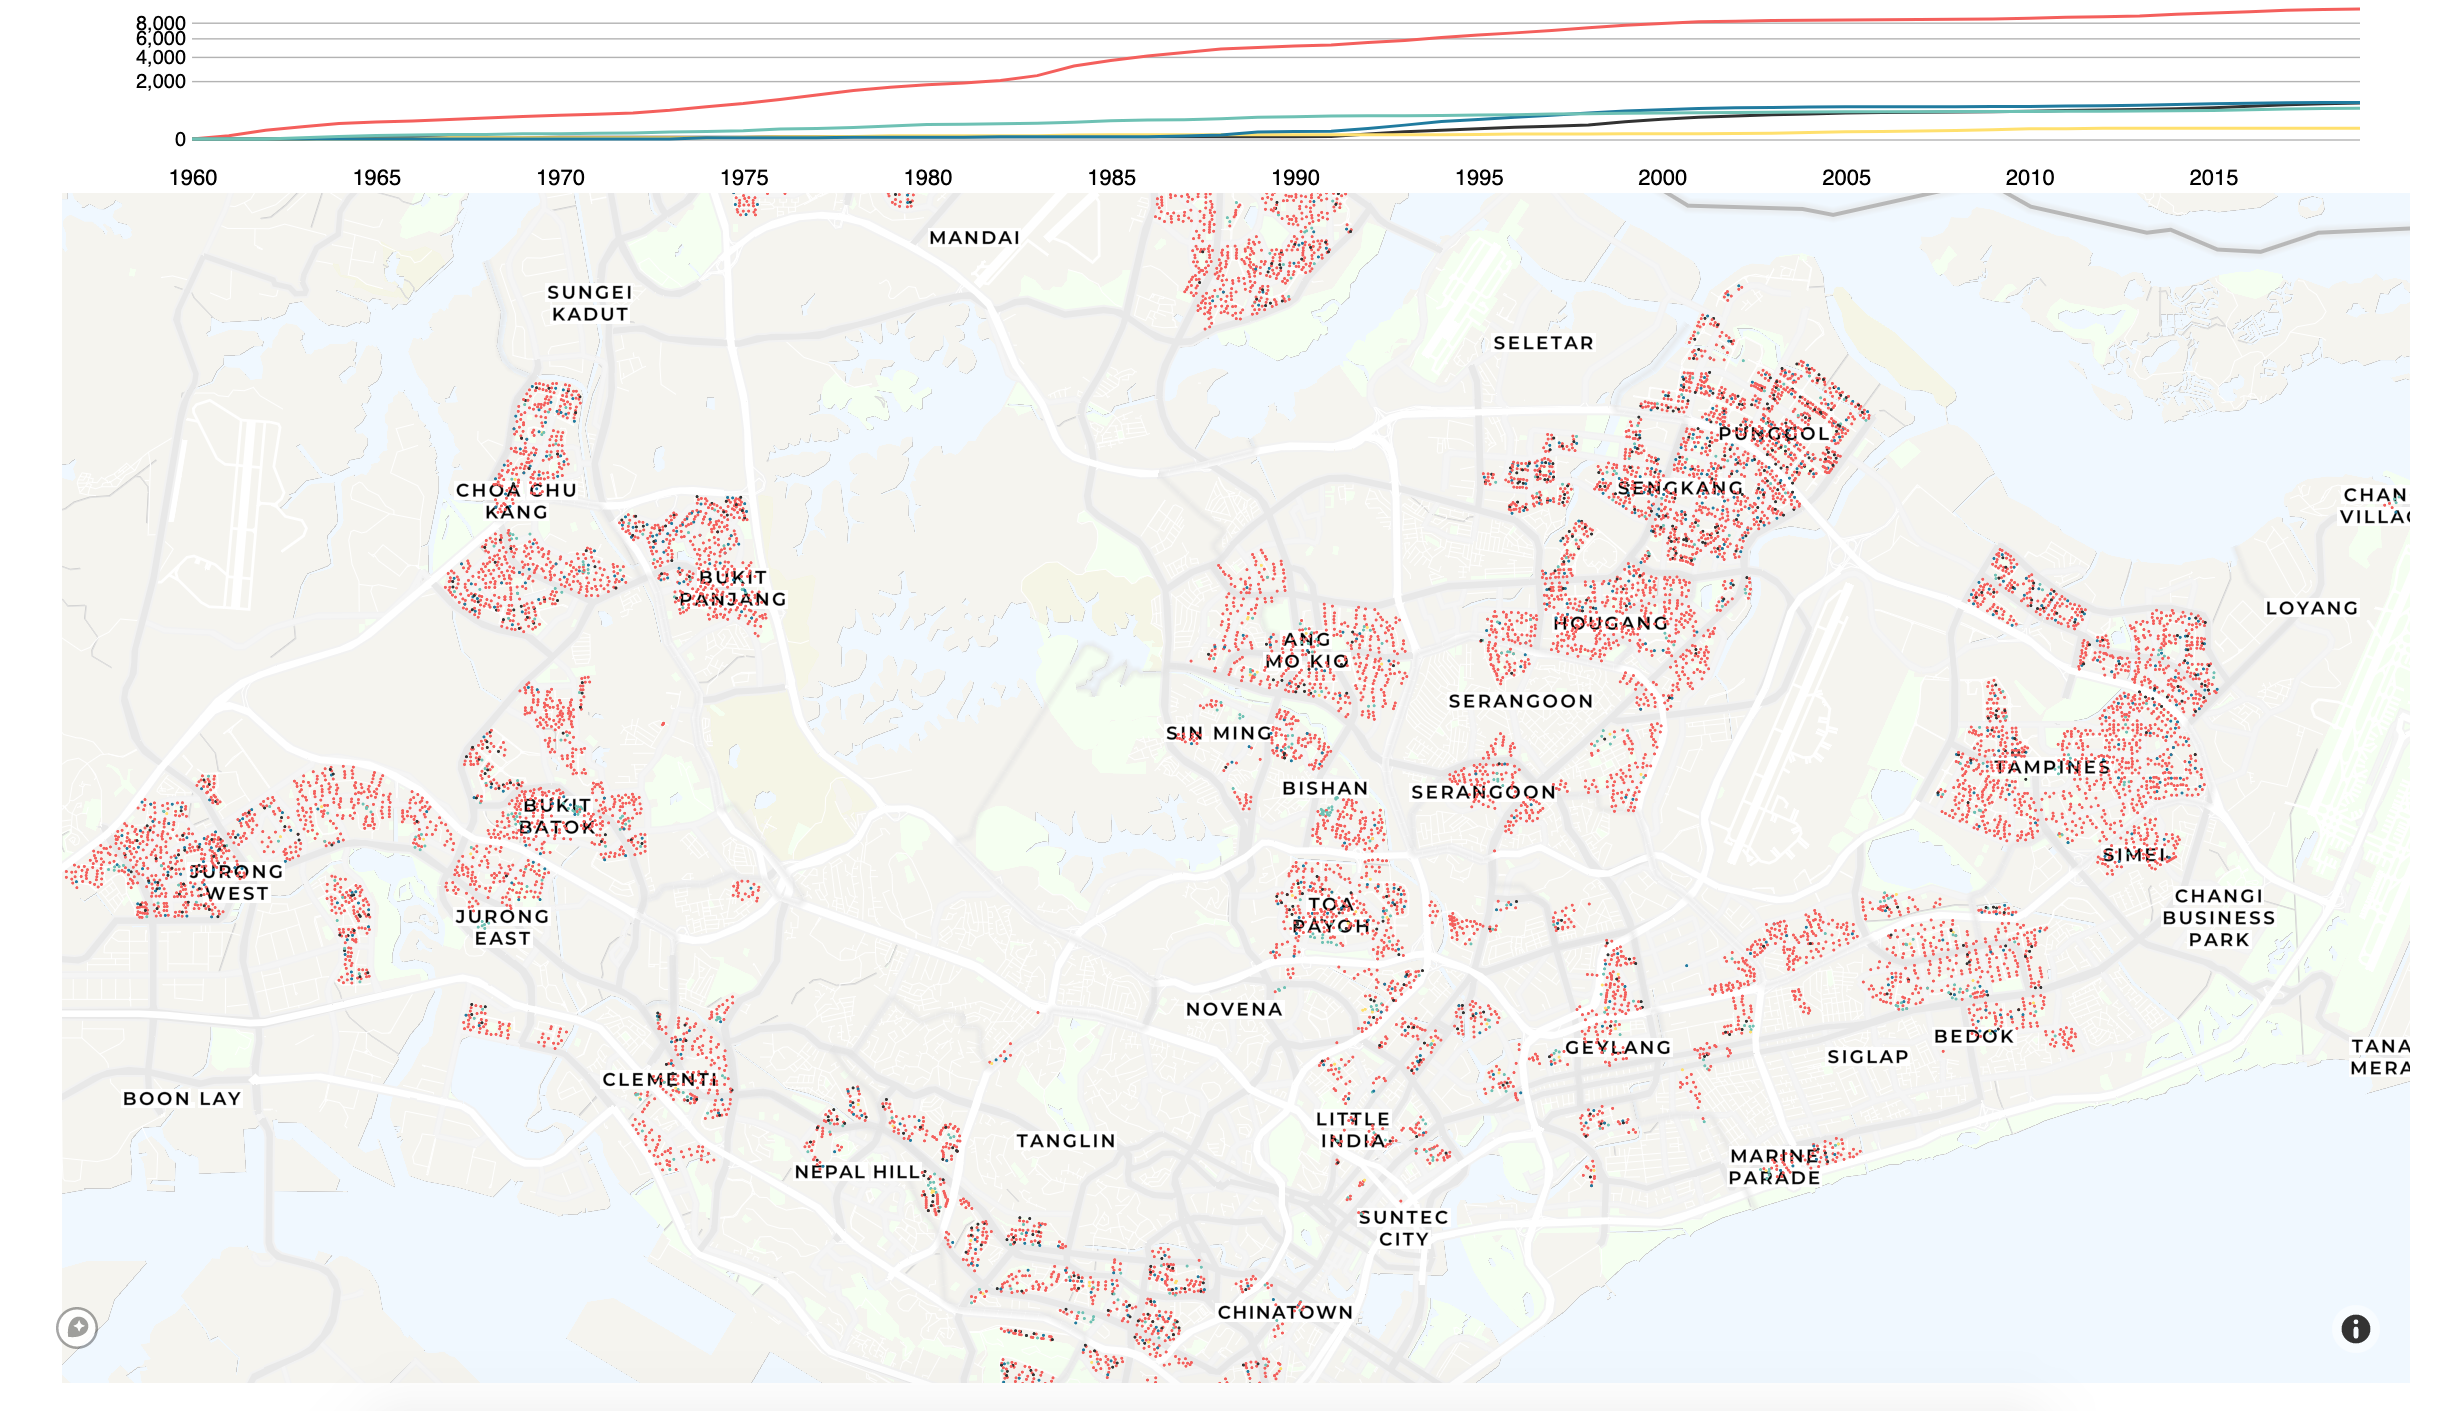
    Exploring and visualizing datasets related to Singapore issues

    Jupyter Notebook 1

  4. vizforsocialgood vizforsocialgood Public

    My entries for the #vizforsocialgood challenges

    Jupyter Notebook 2 1