Moving workloads to the cloud introduces a steep learning curve for developers accustomed to traditional web application development. Cloud-native applications are usually containerized (either Docker or OCI containers) and are run on orchestrated platforms like Kubernetes. These are complex technologies that bring big changes to the development workflow. Can this be simplified? Can developers create cloud-native applications and deploy them to Kubernetes without climbing the mountainous learning curve?
In this quicklab we will take a look at a use case involving Eclipse Codewind, a technology that simplify development of containerized cloud-native applications. Codewind is an IDE plugin that allows you to work with containerized applications in a familiar way. With Codewind, developers can start building cloud-native applications like experts without having to be an expert in all the cloud-native technologies.
If you're running this lab on your own laptop, make sure you have a few things already installed.
Click to expand
This quicklab requires the following tools:
- Docker
- VS Code
- VS Code Codewind extension
We recommend working with the latest available version of each.
Eclipse Codewind is a plugin for IDEs, currently available in VS Code, Eclipse, and Eclipse Che, that helps improve developer productivity when developing containerized applications. Let's explore how Codewind can help you be a more productive developer.
-
Open VS Code (on the Mac, press command + space bar and type "code" into the dialog box)
-
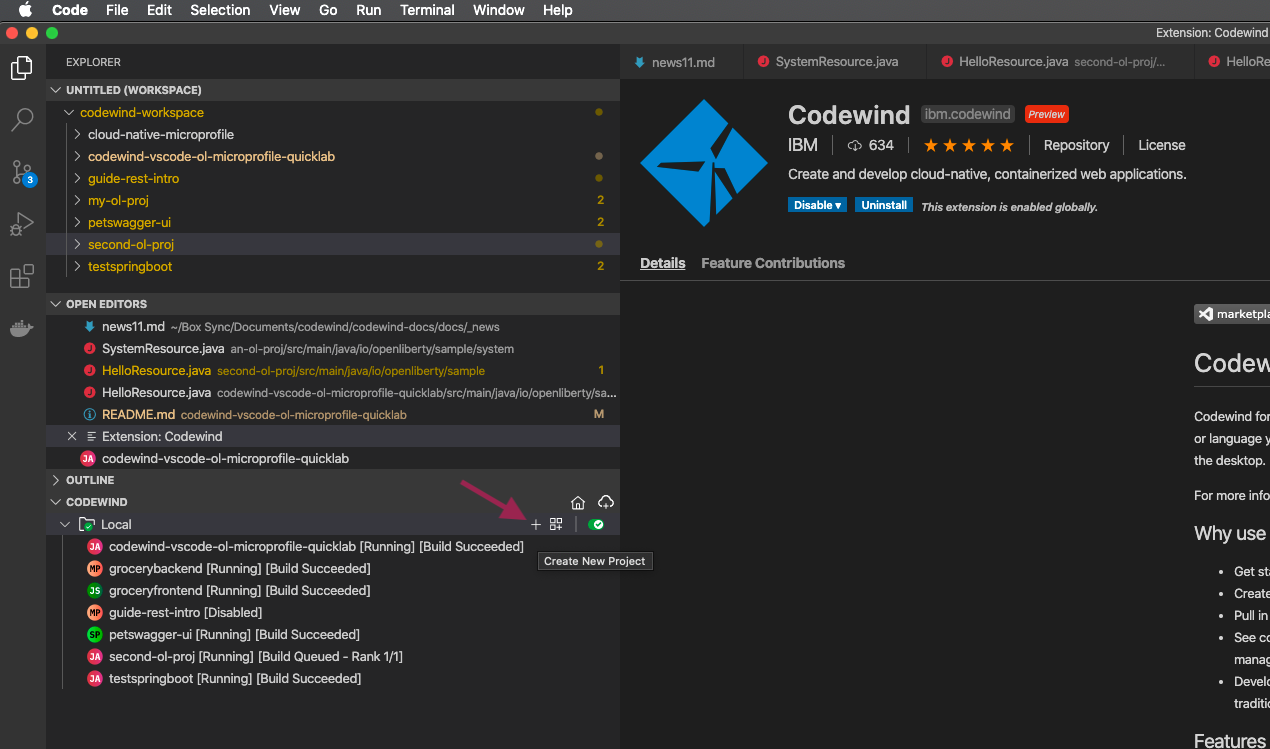
In the explorer window under CODEWIND click on the "+" to create a new project
-
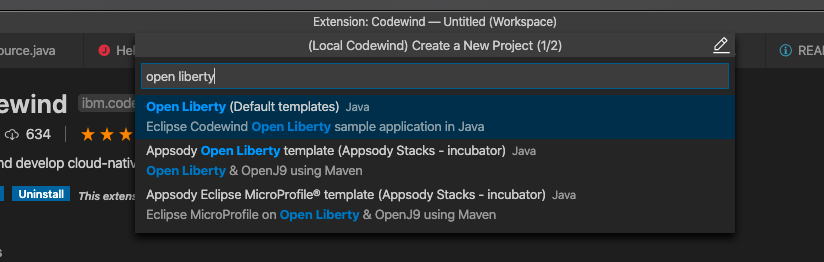
In the dialog pop-up search for "Open Liberty" and select the "Open Liberty (Default templates)" option
-
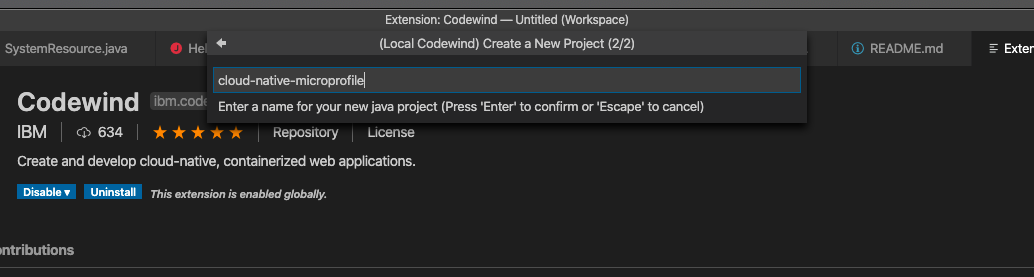
Enter cloud-native-microprofile as the project name and hit enter. You will see a dialogue asking what parent directory you want for your projects. For the purposes of this lab, create a "codewind-workspace" directory during this step (if it does not already exist). In reality, you can choose to place the projects wherever it makes sense for you.
A key to increasing developer productivity is shortening and reducing the friction in the feedback loop. Codewind improves your inner loop experience, enabling you to create a microservice quickly, rapidly iterate on changes and make improvements to performance. As you develop, Codewind automatically pushes your code changes to your container as efficiently as possible.
Let's look at this feature in action.
- In the project workspace under src/main/java/io/openliberty/sample create a new file HelloResource.java
- Edit HelloResource.java to look like below:
package io.openliberty.sample;

import javax.ws.rs.GET;
import javax.ws.rs.Path;
import javax.ws.rs.Produces;
import javax.ws.rs.core.MediaType;
import javax.ws.rs.core.Response;
import javax.ws.rs.QueryParam;

import java.awt.*;

@Path("/hello")
public class HelloResource {

    @GET
    @Produces(MediaType.TEXT_PLAIN)
    public Response hello(@QueryParam("name") String name) {

        return Response.ok( "Hello " + name).build();

    }

}
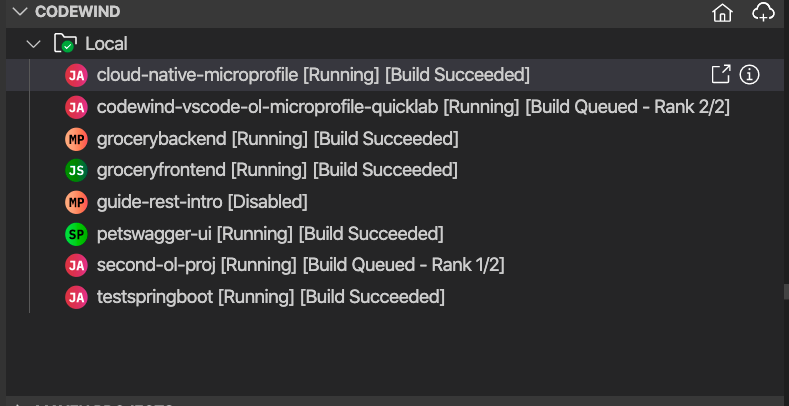
- You can view the status of the re-build and re-deploy by looking at the status indicator next to the project under the Codewind context. Once status returns to [Running][Build Suceeded] you can refresh your browser window to view the change we made. Please be aware that it can take a few seconds until something happens.
- In VS Code click the "Open Application" icon.
- Append
/system/hello?name=Cloud Native Microprofileto the end of the url. You can try adding your own name next time.
You can use the Metrics Dashboard to help you determine if your application is performing as intended. For example, an application might look like it is functioning well, but these metrics can reveal if an application is working harder than it should be. This action is only available when the application is running or debugging.
- Navigate to the Project Overview page. You can do this either by right-clicking on the project in the Codewind explorer and selecting "Open Project Overview" or simply click the (i) information icon.
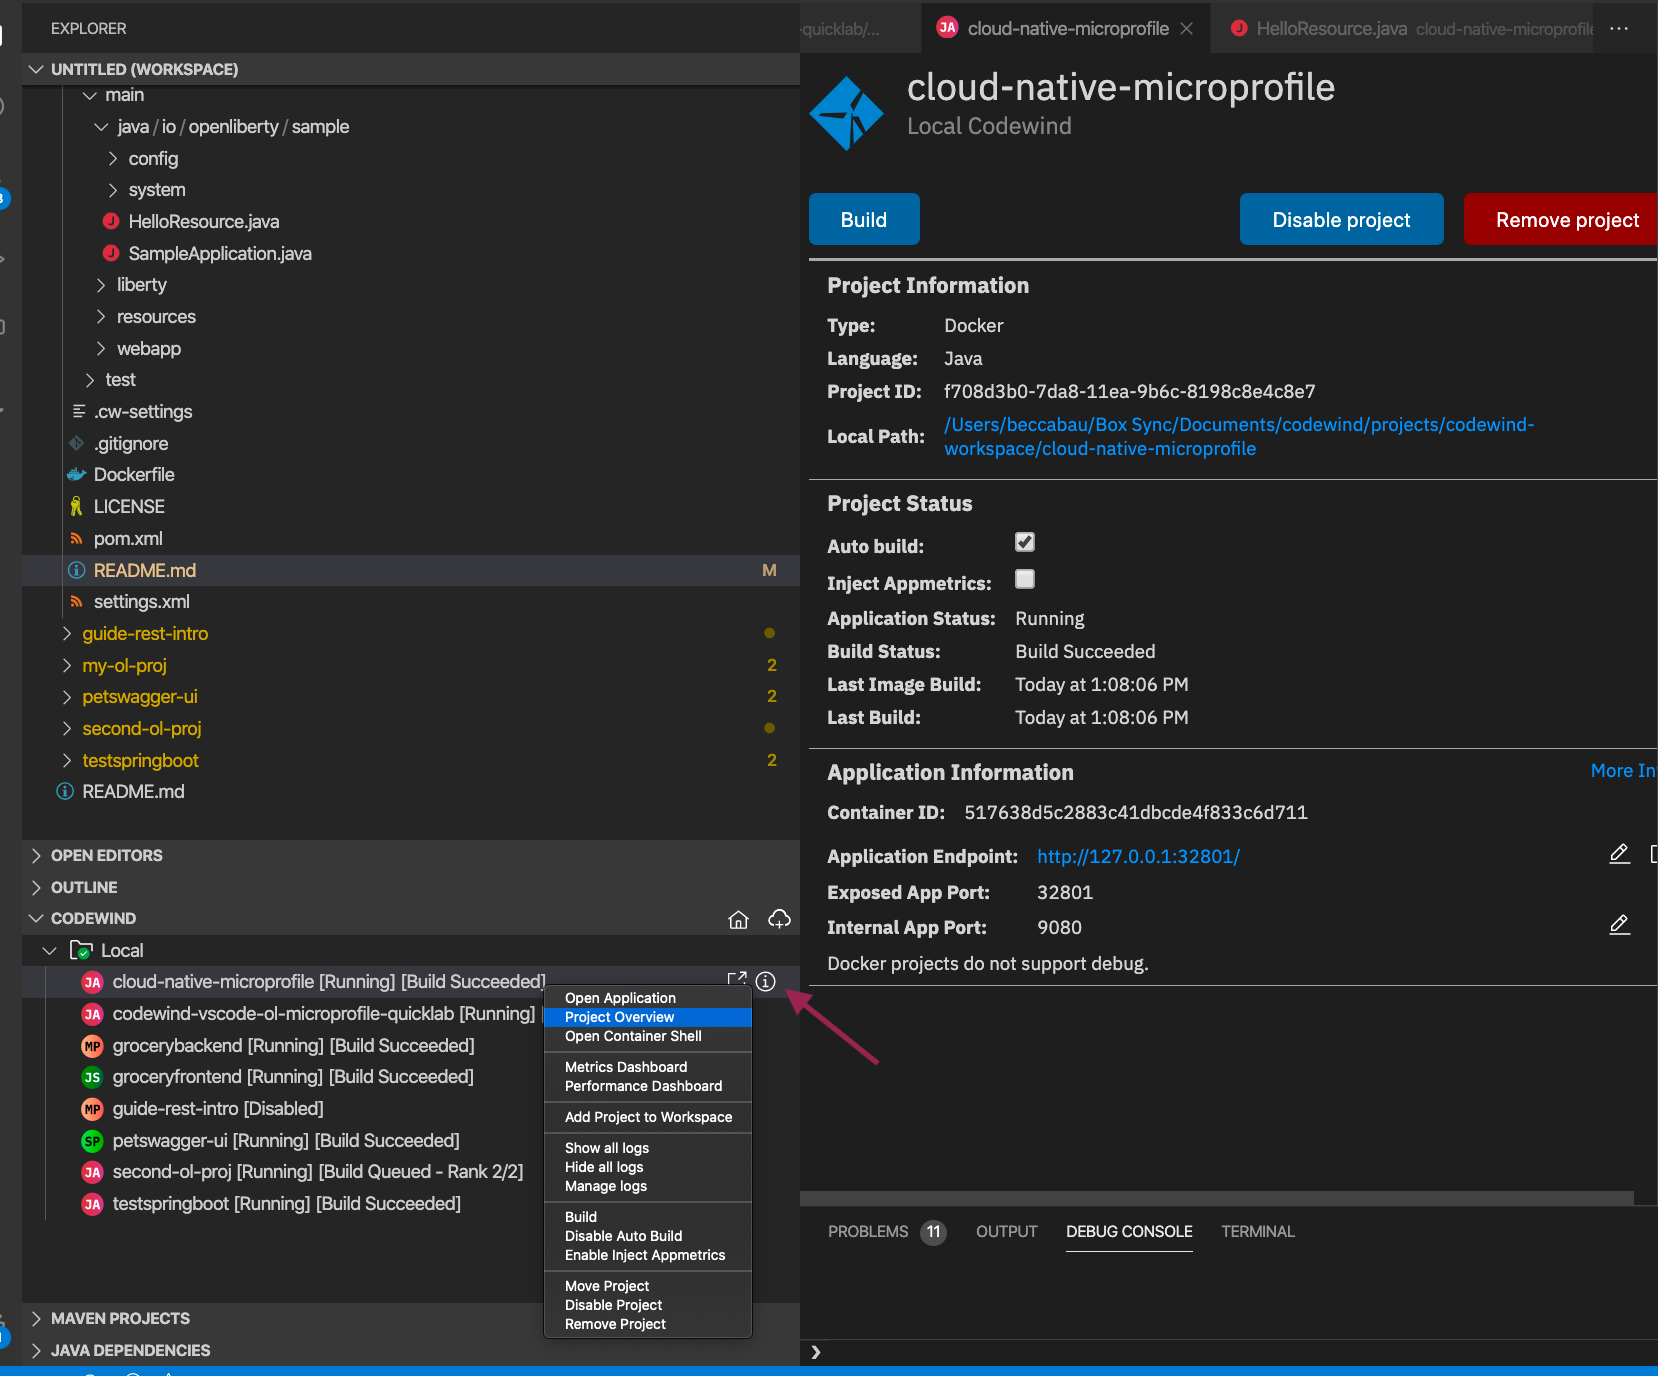
- Enable "Inject Appmetrics."
 Wait for the Application Status to go back to Running - it shouldn't take long.
 - When the status reflects [Running][Build Succeeded], navigate to the Metrics Dashboard.
- CPU: View this graph to see whether your computer is keeping up with the work you’re doing. If you have spare CPU cycles, your machine is likely keeping up with your throughput. If you don’t have spare CPU cycles, you might notice a degradation in performance.
- HTTP Incoming Requests: View this graph to see the incoming requests that your microservice receives. You can track the incoming requests and their response times. The graph doesn’t show each request. Instead, it shows requests at specific points in time. Use this graph to see whether your application responds to the requests as quickly as intended or if a change created delays in response times.
- Memory: Straight horizontal lines and lines that plateau indicates good memory. An ascending line indicates a memory leak and that the computer is running out of memory.
- HTTP Throughput: This graph indicates how fast the application is processing the requests that are coming into it.
- Heap: This graph is only available for Java and Node.js projects. It displays the heap size and the used heap on a timeline.
- HTTP Outbound Requests: This graph is similar to the HTTP Incoming Requests graph and shows the number of outbound requests at specific points in time.
- Loop Times: This graph indicates how fast a Node.js project is processing through an event loop.
- Other Requests: This graph indicates the Socket.IO and other requests that the application processes.
Viewing the logs of your application running in a docker container is easy from the IDE with Codewind.
To view the logs for an application, right click on it and select "Show All Logs"
The logs for the running application will be shown in the IDE console log window on the bottom right of the page.
# codewind-vscode-openliberty-walkthrough