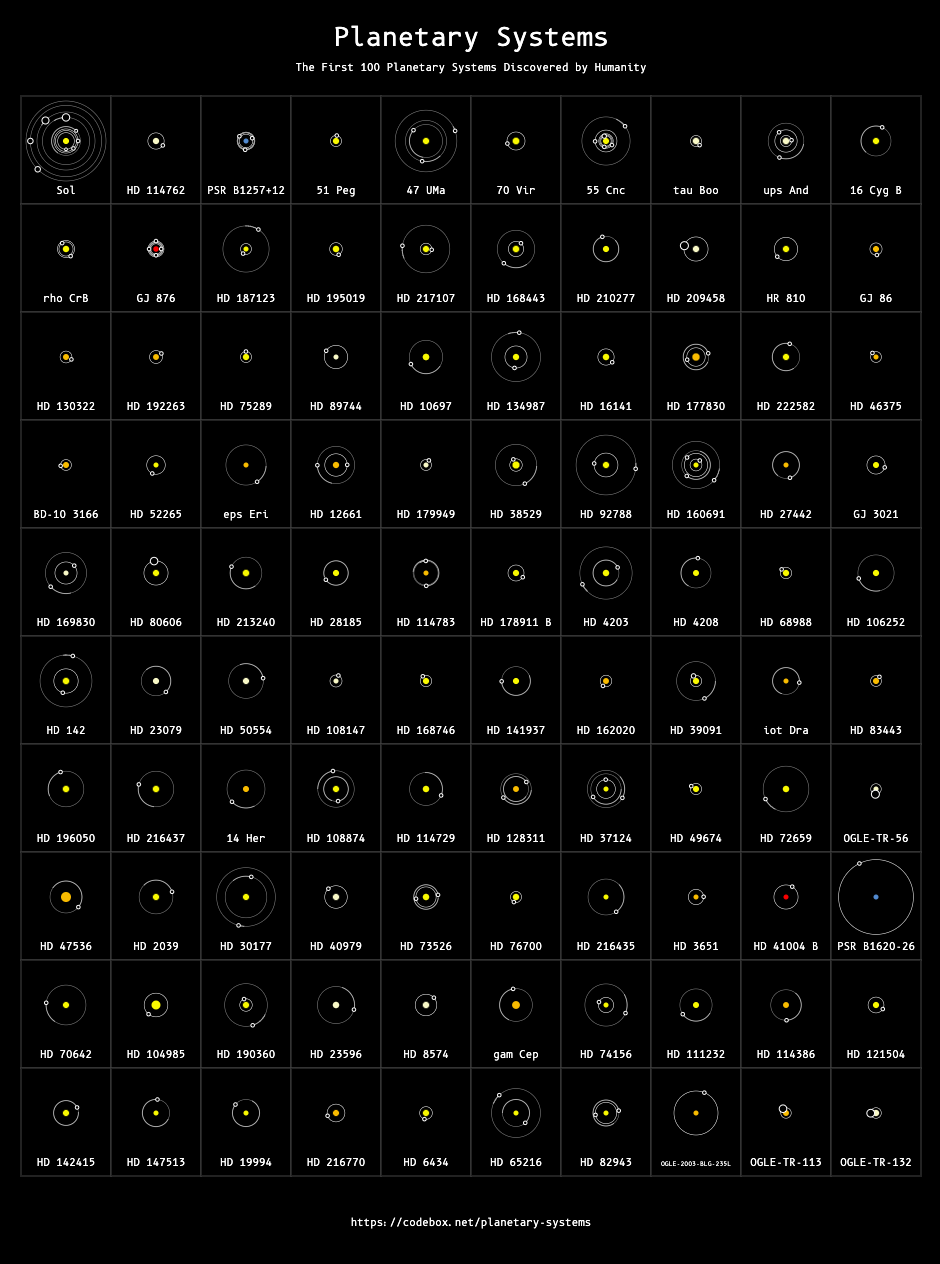
This Python utility uses NASA data to generate diagrams of planetary systems. You can find some pre-generated diagrams here
The script has been written using Python 3, and has no external dependencies. To generate a diagram just run the following command from the root of the project:
python src/main.py
The script will automatically download the latest data from the NASA Exoplanet Archive and generate an SVG file containing the diagram. The number of planetary systems that will be included can be changed by adjusting the star_count config value. This value, in combination with the sort_order parameter, determines which systems are included in the diagram.
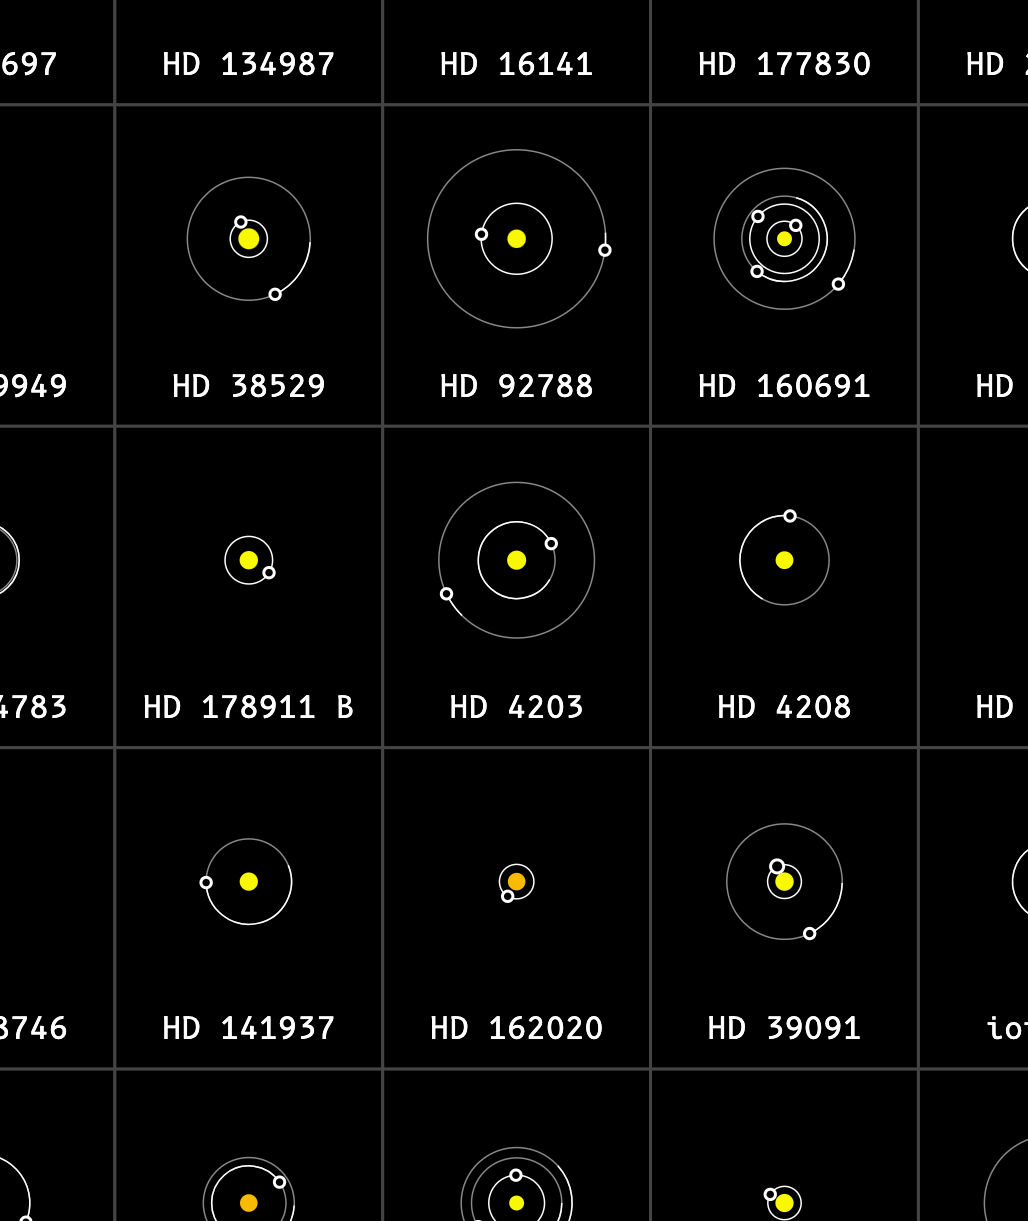
For reasons of legibility the sizes of the planets, stars, and orbits have been drawn using logarithmic (rather than linear) scales. Different scales have been applied to the different types of object, so for example the difference in size between two orbits is meaningful, but the difference in size between a star and a planet is not. Data for some objects is missing from the NASA archive, where values are missing reasonable defaults have been used.
Orbital speeds are illustrated by highlighting what fraction of its orbit each planet completes in 1 year. If a planet completes its orbit in less than 1 year its entire orbital path is highlighted: