gitstats reads GitHub data and feeds structured data to an ELK stack (Elasticsearch, Logstash, Kibana).
NOTE: as of version 0.3.0, these options will be ignored.  Gitstats will automatically launch with the --deletedb option,
and will cycle once an hour during steady-state operations using the -c option.  The code to use these option is present,
just commented out.

node app.js [option]

Options:
        -c, --collect   create a database (if necessary) and collect stats
                          generated since the last run
        --deletedb      re-create the database and collect stats
        -h, --help      print help (this message)
gitstats requires you to use a personal access token
Make a copy of config-sample.js and name it config.js.
Open config.js in a text editor and update as described below:
'orgsfile': './orgs-sample.json',   [point at your org file, see 'Create an org file']
'collect_commits': true,            [true or false]
'collect_pull_requests': true,      [true or false]
'collect_stargazers': true,         [true or false]
'interval_git': 1000,               [github processing interval in milliseconds
                                     anything faster than 1000ms may cause GitHub to flag
                                     your account for rate-limit violations]
'interval_db': 100,                 [database processing interval in milliseconds
                                     anything faster than 100ms my cause timeouts
                                     when using a remote database
'port': 80,                         [gitstats application port]
'host': 'localhost',                [gitstats application host]
'db': {                             [this section is for NoSQL db]
    'name': 'sample',               [db name - NOTE: this will also be the name of your
                                     ElasticSearch index and logstash.conf]
    'host': 'localhost',            [host]
    'port': 5984                    [port]
    'protocol': 'https:',           [protocol]
    'user': '',                     [username (basic auth)]
    'password': ''                  [password (basic auth)]
},
'git': {
    'hostname': 'api.github.com',
    'port': 443,
    'protocol': 'https:',
    'personaltoken': ''             [GitHub personal access token]
}
Make a copy of orgs-sample.json. Name it whatever you like, but be sure to
update the orgsfile setting in config.js.
Open your org file in a text editor, and update it as described below.
gitstats is capable of reading stats from GitHub organizations, users, or repositories.
organizations and users are collections of one or more repositories.
gitstats will automatically enumerate organizations and users so
long as you specify the correct type, as demonstrated below:
[
    {"name":"Open-I-Beam", "type":"org"},
    {"name":"ibm-bioinformatics", "type":"user"},
    {"name":"cognitive-catalyst/cognitive-catalyst", "type":"repo"},
]
note: You will also need to reset the logstash sequence path each time the database is reset.
This is stored in a file located in the \bin directory of you logstash deployment, and will
be named according to the value of the sequence_path attribute contained in logstash-sample.conf.
gitstats requires the following middleware/services:
- [NodeJS](https://nodejs.org/) v4.2.1+
- [ElasticSearch](https://www.elastic.co/products/elasticsearch) v2.1+
- [LogStash](https://www.elastic.co/products/logstash) v2.1+
- [Kibana](https://www.elastic.co/products/kibana) v4.3.0+
The instructions below assume you run all components locally; however, you may mix and match. For example, you could run Node, CouchDb, Logstash, and Kibana locally, and point at an ElasticSearch instance in the cloud.
Virtually any NoSQL database will do. You can either install your own, or point at an existing NoSQL cloud service.
2. Install and run Elasticsearch
You can either install your own, or point at an existing ElasticSearch cloud service.
Create the ElasticSearch index using the following command:
curl -XPUT http://[Elasticsearch IP]:[port]/sample -d '[paste the contents of dwopen-logstash-index.json]'
If your instance of ElasticSearch requires basic auth, use this:
curl -u username -XPUT http://[Elasticsearch IP]:[port]/sample -d '[paste the contents of dwopen-logstash-index.json]'
Replace username with - you guessed it - your ElasticSearch username. You will be prompted for the password.
NOTE 1: the json file contains line breaks for readability; you will need to remove the linebreaks manually, or with a free online tool such as Text Fixer
NOTE 2: sample is the name of the created index and should also be used in logstash.conf - refer to the db:name parameter in the Configuration section below.
After running the command, you should get a response like this:
{"acknowledged":true}
3. Install Logstash
You can either install your own, or point at an existing Logstash cloud service. Create a logstash.conf file from the template provided (logstash-sample.conf)
4. Install Kibana
You can either install your own, or point at an existing Kibana cloud service.
Be sure to update \config\kibana.yml to point it at your ElasticSearch instance
Open Kibana in a browser, then open Settings and then Indices
Click on "Add Index" and enter 'dwopen' - the "Create" button should light up. When it asks for the date field to index on, choose 'doc.date'
Open Settings and then Objects and then import dwopen-visualizations.json and then dwopen-dashboard.json
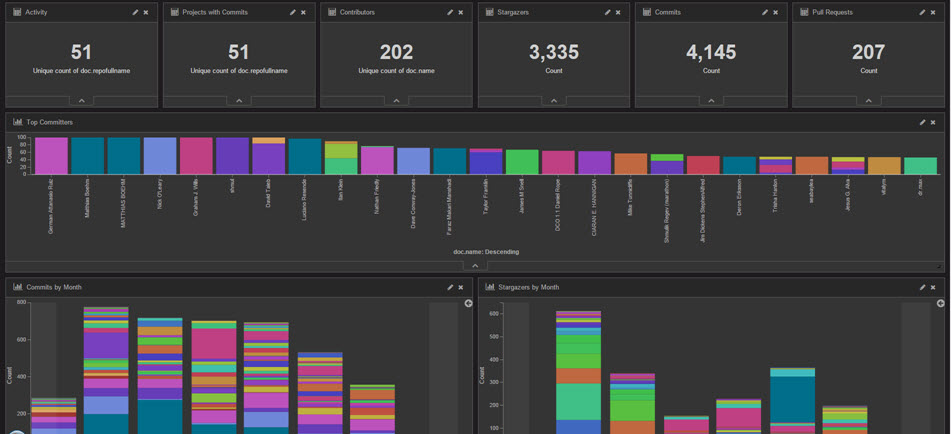
Open Dashboard, and load "dWO Dashboard"
If you don't see any data, change the timeframe by clicking the timer in the upper right corner of the dashboard.