A novel model for code smells visualization that addresses existing limitations.
Visualization of code smells is an important apporach for developers that can help improve code quality, communication, and understanding. By using visual representations of code issues, developers can quickly identify potential problems and work to address them before they become more serious issues.
Proposed a code smell visualization approach using two metaphors together to gain more complete understanding of the code-base. The metaphors of "island" and "city" are used that it helps to illustrate different aspects of the code and the relationships of the code in different abstract levels.
The tool will be able to generate 3D visualizations for buildings, islands, inside building views according to input dataset.
sample data set
{
  "classes" : [
    {
      "class_name": "Product Class",
      "class_id" : 1,
      "no_of_lines" : 123,
      "position": [
        {
        "x": 3,
        "y": 1,
        "z": 4
        }
      ],
    "is_code_smell" : "yes",
    "smell_type" : "Empty Class",
    "color_code" : "1, 0, 0",
    "code_snippet" : "final class DEFAULT { }",
    "methods" : [
          {
          "method_id" : 1,
          "name" : "getTransferData",
          "no_of_lines" : "12",
          "no_of_attributes" : "int status = 0;",
          "is_code_smell" : "no",
          "smell_type" : "",
          "code_snippet": "",
          "color_code" : "1, 1, 1",
          "priority" : "",
          "class_id" : "1",
          "effort" : "9",
          "suggested_code" : "",
          "suggested_links" : "",
          "position": [
            {
            "x": -5,
            "y": 1,
            "z": 34
            }
          ],
          "parameters": [
            {
            "pname" : "String[] args"
            },
            {
            "pname" : "Properties additionalUserProperties"
            },
            {
            "pname" : "ClassLoader coreLoader"
            }
          ]
        }
    ]
  }
 ]
}
Zooming, localization and browsing are essential features that are under consideration.
This tool will be able to zoom in or out the buildings. The tips, navigations, summery graphs feature helps developers to navigate through buildings in 3D environment.
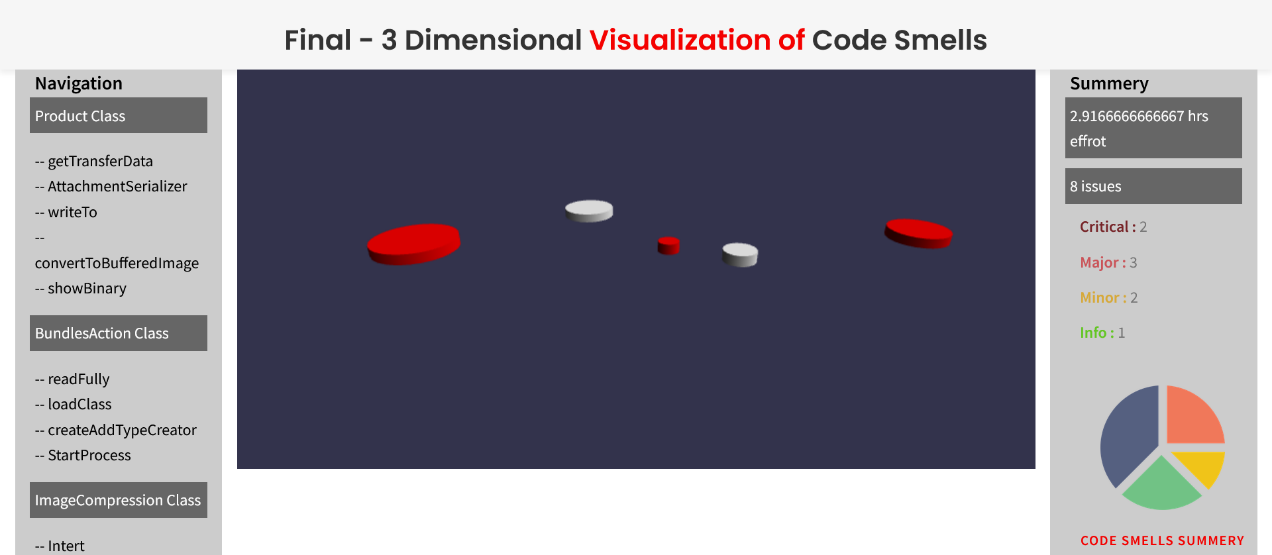
Figure 01. 3D Model for Island Metaphor
Figure 01 illustrate the automatically generate class-level mode in the visualization tool. This perimeter of the cylinder island view vary from the dynamic values in the database and this perimeter calculate based on the number of code lines include in the class. The dark red color used to highlight the code smells including classes.
To move to next abstract level need to click on a class.
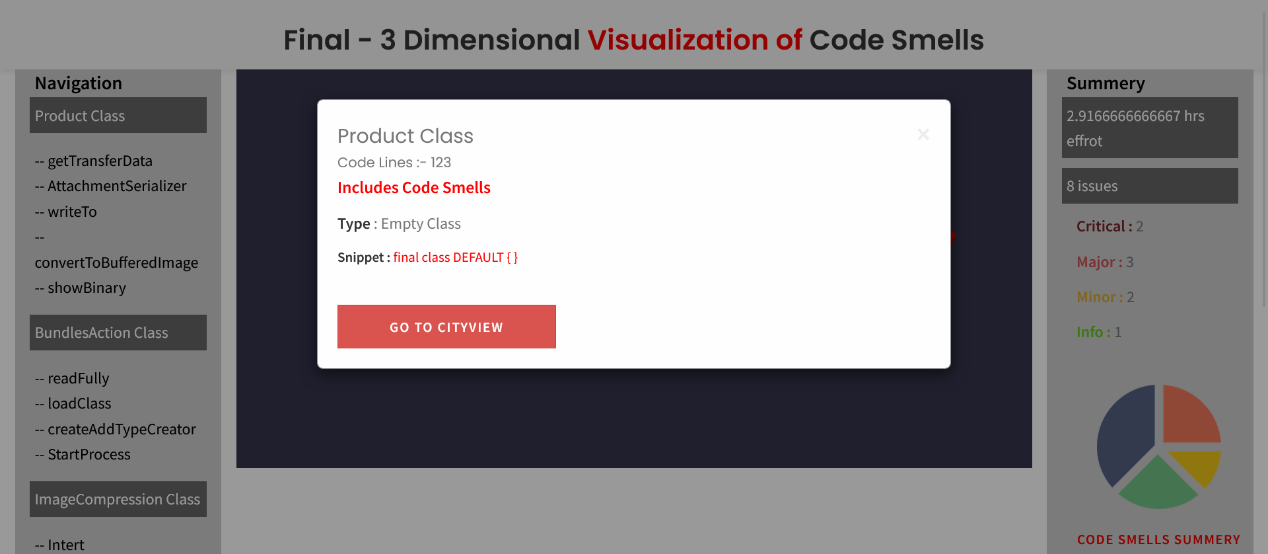
Figure 02. Message box with details of the Class in Island Metaphor
Figure 02. Pop up message box displays details such as Class Name, number of Code Lines include in the class. Is code smell include in class or lower member level ?
Finally, link to next abstract level.
Figure 03. 3D Model for City Metaphor
Figure 03 shows the block view for the methods inside the class as the main components of the method level in proposed framework.
The method block is shown on the different dark colors of the ground represent the class since it is a method related bad smell. These different colors based on their severity. The severity levels are critical, major, minor and info.
Figure 04. Message box with details of the Method in City Metaphor
When a method includes code smells, this method listed details of code smell type, snippet and it severity in detail.
Finally, user can move to the inside method view by click on the Got to Classroom button.
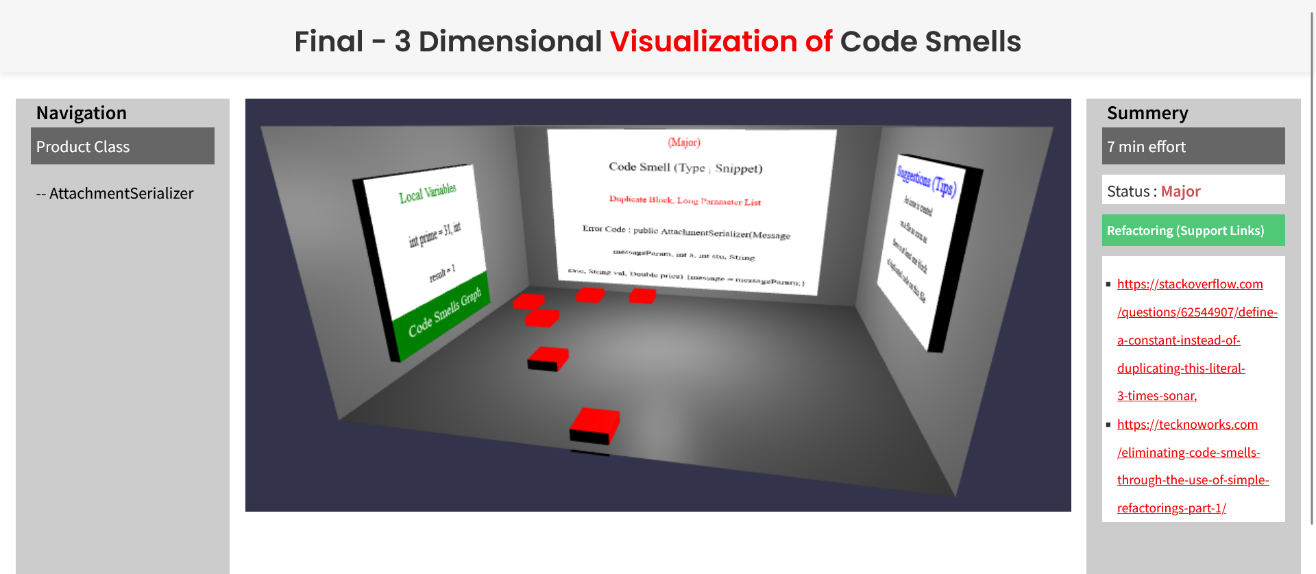
Figure 05. 3D Model for Inside Building
Figure. 05 displays the view of inside method. It consists of three walls with more details. The number of boxes in the floor models the number of parameters for each method. The code smell type and error code is shown on the whiteboard in the main wall of the building.
The smell founded from the process provide the suggestion and tip to solve this code smell issues in right side wall whiteboard.
Figure 06. Parameter Names of Inside Building
Figure. 06 shows more visualizations about the parameters include in the method. The box on the floor represents the parameters and each popup box contains the parameter name.
Figure 07. Code smells % include in the Method
Figure. 07 illustrates how concerns are represented in the Pie chart. The portion colored in dark red correspond to smell code percentage in method that are affected by a specific concern.
Currently, visualize the module of the software tool that is developed based on Babylon.js (JavaScript Library), Code Igniter (PHP Framework) and MySQL. The visualizations of development allows us to visually explore the overall architecture in different abstract levels.


