Analysis by Cam Rodriguez, for Dr. Michelle Stuhlmacher's GEO 442 Earth Observation II class at DePaul University. :)
The analysis itself is built out of Google Earth Engine, a cloud-based remote sensing tool that utilizes Javascript to create web-based viz. In order to access the code in the program, an Earth Engine account is required. (An account is not required to access the web app, but it is required to run the code.) The code is also within this repo for easy access!
Code link: https://code.earthengine.google.com/29b96abf5a7fa0d3fd76ecedc4a3a605 Web app: https://cam-rodriguez.users.earthengine.app/view/mexicos-coastal-cities
In a pre-pandemic world, spring breaks and summer vacations became inseparable with major resort cities along Mexico’s coastline: Cabo (San Lucas and San Jose), Acapulco, Puerto Vallarta, Cozumel, Playa del Carmen, Tulum, Veracruz, Cáncun.
Following federal support and subsidy of what would become anchors of Mexico’s tourism industry in the 1960s, cities within the Yucatan Peninsula, particularly Tulum and Cáncun, have swelled into massive tourist destinations, raking in millions and turning from a heavily forested jungle to a booming city for resorts, cruise line stops and other mainstays of the tourism industry – in less than 30 years (Murray 2007, 341).
It’s this sudden explosion of development that has not just contributed to massive economic impacts on the country, but land use impacts as well. As resorts expand, real estate and vacant lots become high-priority, and natural resources can be subject to overuse: like in Cabo San Lucas, where the average estimated rate of water consumption per five-star hotel room equaled that of 4.3 residents (Graciano, Ángeles, and Gámez 2019, 11-13).
While environmental degradation has been researched and tracked in Mexico’s resort towns for years, particularly in concert with other coastal urbanization and economic development, like with intermodals and energy/infrastructure-related projects (Ortiz-Lozano et al 2005, 161-176), a study of this scale and scope – holistically looking at Mexico’s tourist hotspots across different tourism corridors – hasn’t, and can provide insight into one facet of how cities are coping with coastal tourism demand.
As the industry faces several rebounds in the face of the pandemic, and summer is quickly approaching, now is as good a time as any to look at how the past two decades’ worth of seaside tourism in Mexico have impacted the rapid urbanization of coastal communities, and how the area gain of man-made construction and built-up land may create implications for the loss of vegetated land, both environmentally and economically, over the past twenty-two years.
While initially the approach was to use a dataset derived from MODIS like the MODIS Land Cover sets, ultimately self-classification based on Landsat 7 imagery was used. This was for a few reasons: Landsat’s mission timeline aligned with the scope of the study timeframe, which was between 2000 and the present. Using tier-1 imagery did yield some inconsistencies for data after 2003 due to the failure of the Scan Line Corrector (USGS, n.d.), but ultimately provided a consistent single dataset to work from for a time period between January 1, 2000 and January 31, 2022.
Nine study areas were selected for the analysis, primarily on the basis of popularity and notability for being top tourism destinations within Mexico that also were coastal and/or island-based cities. The cities included four within the Yucatán Peninsula region (Cáncun, Tulum, Playa del Carmen and Cozumel, which is an island home to San Miguel de Cozumel, a tourism-anchored city), two within the Baja California region (San Jose del Cabo and Cabo San Lucas, also known as Los Cabos), one located along the Gulf of Mexico (Veracruz) and two located along Mexico’s Pacific coastline (Acapulco and Puerto Vallarta). After locations were selected, geometries were drawn around each general study area; coordinates from each area were additionally collected.
After the Landsat imagery was filtered by date and by bounds (a polygon around Mexico), a classifier was built; it utilized Random Forest, a supervised regressive classifier. Input for the classifier were 120 polygons of man-made construction (“built”) that included structures like parking lots, roofs and other infrastructure, and 120 polygons of undeveloped construction (“not built”) that included vegetation, sand and water. Inputs were chosen initially from just Los Cabos locations and limited to 60 built and 60 not-built samples, but was doubled and revised to include all locations in order to garner a more holistic sample of land use, because land type varies between the different locations and environments.
The classifier was applied to composites of select years within the study timeframe, including 2000, 2005, 2010, 2015, 2020 and 2022, which spanned January 1, 2021 to January 31, 2022, to provide for a “present day” sample. (Later dates in 2022 were omitted for data quality purposes.) Composites by year were then masked to showcase only the classified areas, which displayed the built-up regions of the landscape at that point in time.
Differences between year pairs were also rendered, primarily looking at the difference in built-up land between 2000 and 2000+n year (ie, 2000 to 2005, 2000 to 2010, etc). These also were masked to only highlight the change in the two classified composite masks, displaying just the difference between the two layers.
In order to assess built land development over time, a function was created to calculate and return the pixel area for each classified composite layer within the region of each city’s study area bounds, effectively capturing the area in square meters of each city’s footprint from 2000 to 2022 based on the classifier’s output.
For the user interface, the map is centered on Cáncun and the Yucatan Peninsula, to highlight the core mass of tourist cities there.
Widgets were anchored within a panel; after the city coordinate points were established, users could toggle between different locations. Additionally, users can select and deselect layers highlighting the different classified composite masks and the masked differences, with a restart button deactivating the layers and setting the map back at the default location over Cáncun.
Based on the analysis, a demonstrated increase in built-up land use over the nine study areas was showcased, with footprints visibly changing over the 22-year span. Between 2000 and 2022, overall built land use increased by approximately 80,000 square kilometers, or 83.24%; between 2000 and 2010, land use increased by approximately 64,000 km², or 61.73%.
 Figure 1. Land use pixel area change over time between the study areas, highlighting the different cities’ overall change. (View interactive chart here: https://www.datawrapper.de/_/EVg8I/)
Classified built land use varied across certain cities, with some regions having more demonstrated change than others. In Los Cabos, the area saw the highest percent change between 2000 and 2022 than any other region, with an average percent change increase between 2000 and 2010 of 230.89%, and an additional 23 percentage point increase between 2010 and 2022; San Jose del Cabo, for example, saw a built-up pixel area increase from 918.14 km² to 3,351.02 km², a 265% increase over 22 years.
The highest value rendered by an individual city was Playa del Carmen, which jumped from 1,426.46 km² of built land in 2000 to 8,874 km² in 2022, a 522% increase. It stood out relative to other shifts over time in the Yucatan Peninsula region, including a 68.66% increase between 2000 and 2022 in Cáncun.
Questions about the integrity of the classifier itself are an area of future study and growth, particularly as possibly inconsistent classifications rendered with possible inaccuracies. These potential inaccuracies yielded results like a negative percent change indicating that the sprawl of Cozumel dropped by half from 2000, the only such result, or that between 2000 and 2010, Tulum saw a 39% percent change, but only 0.34% between 2000 and 2022, despite infrastructure being in place.
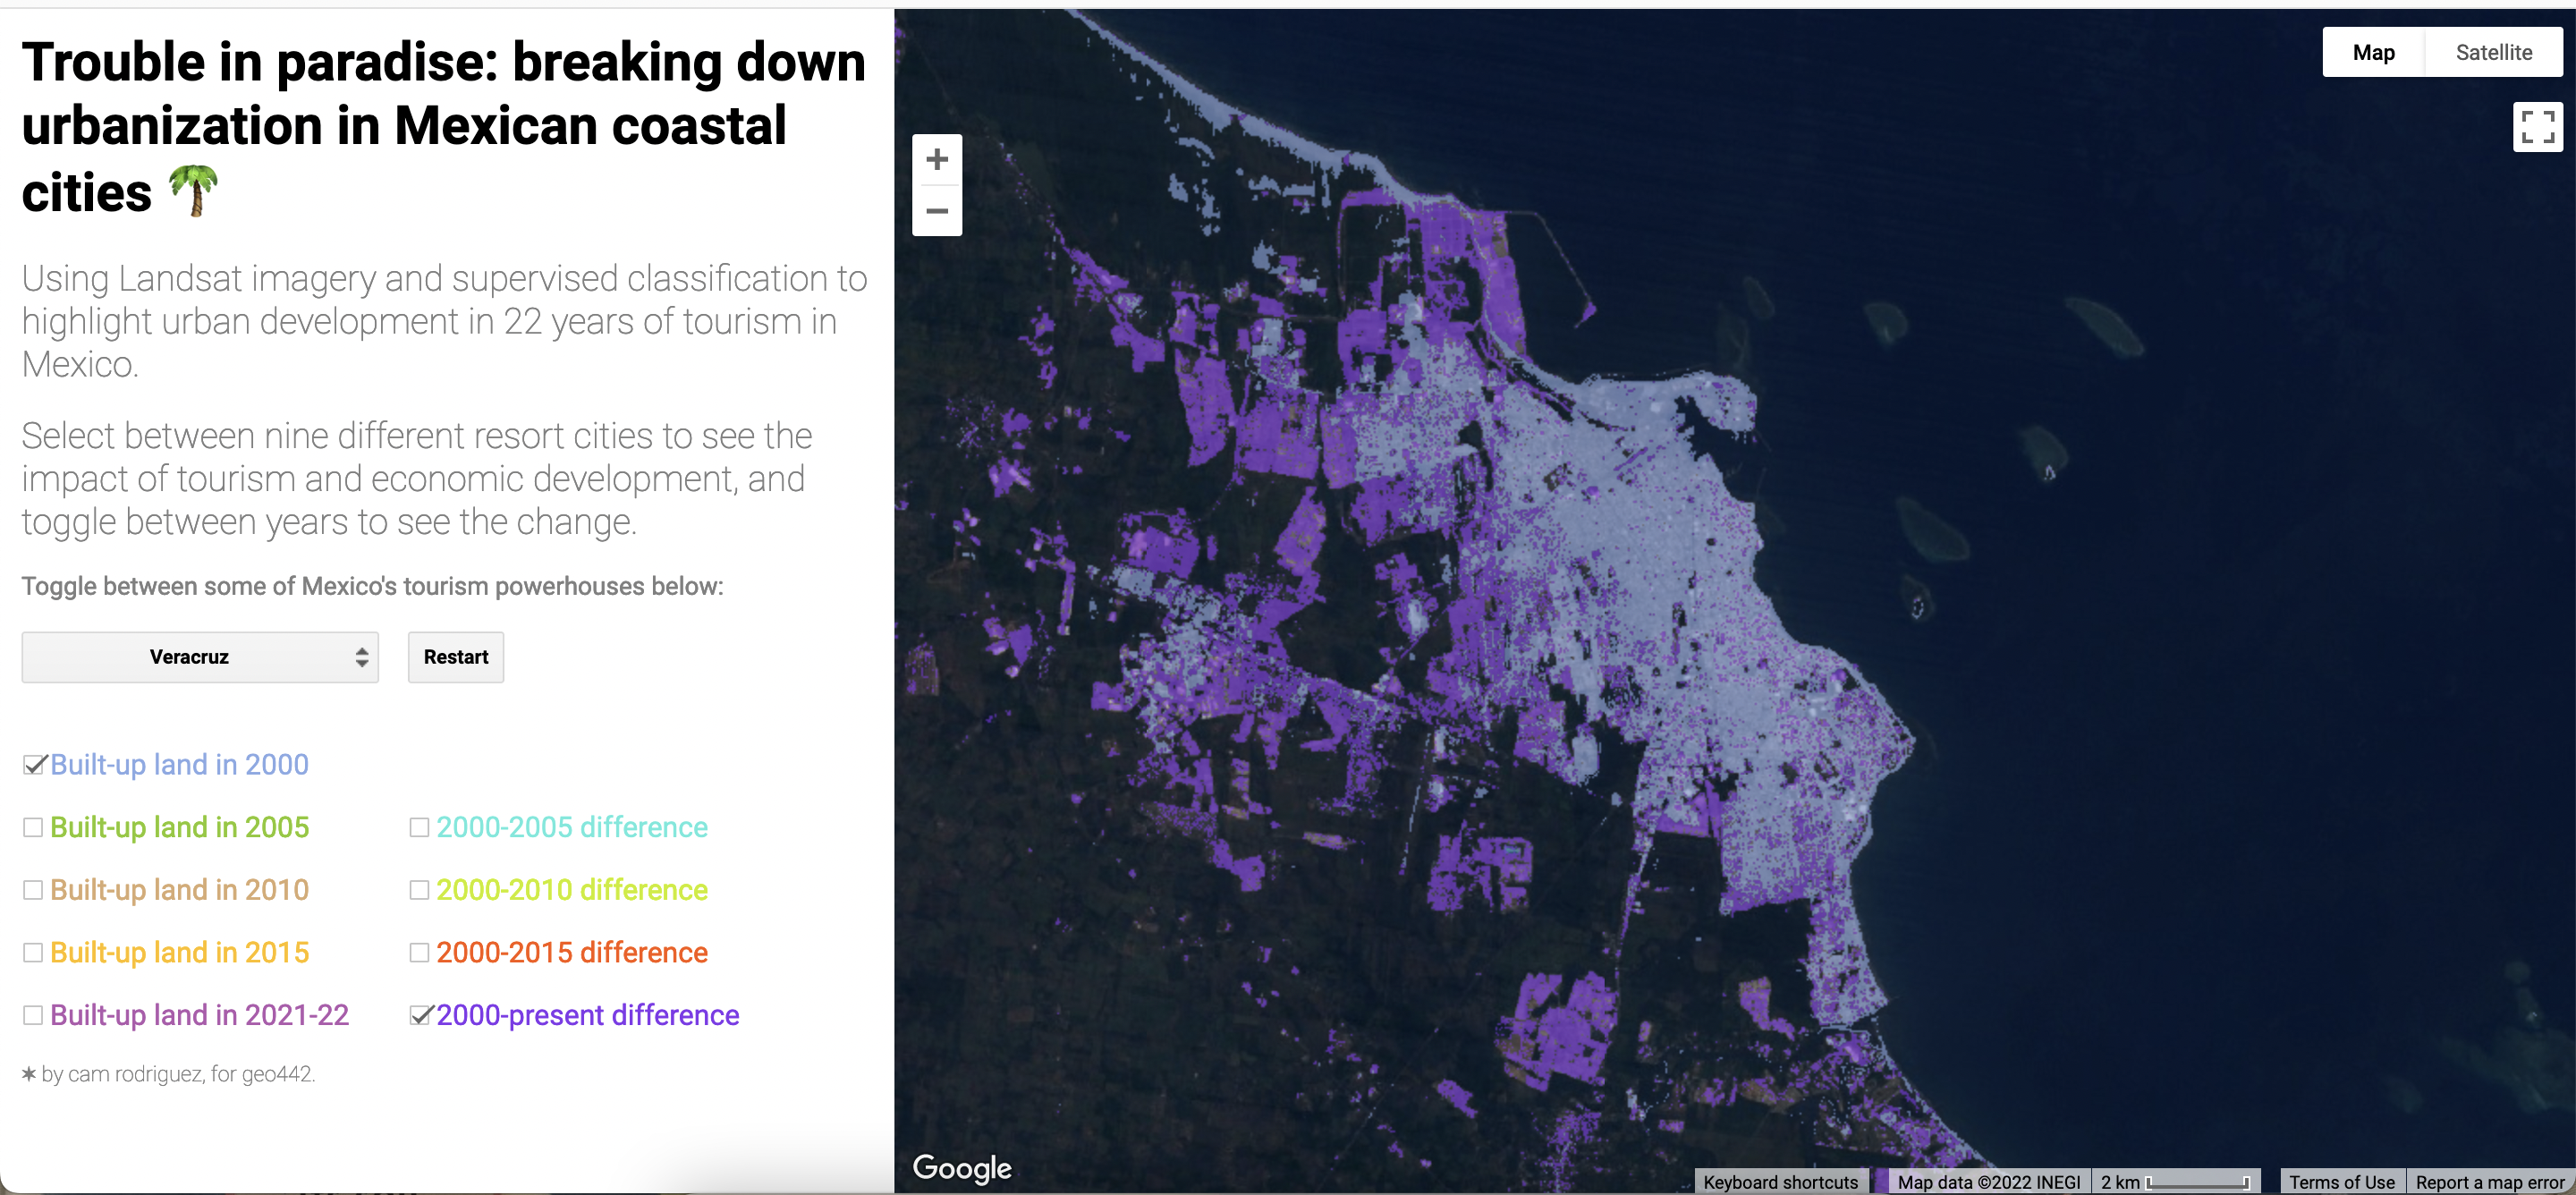
 Figure 2 and 3. (Left) Built-land change between 2000 and 2022 in Veracruz, pulled from the UI. The land classified as built in 2000 is highlighted in light blue; the difference in classified built land between 2000 and 2022 is highlighted in purple. Land use patterns are clearly and distinctly highlighted, with the change easily visible. (Right) Built-land change between 2000 and 2022 in Tulum, pulled from the UI. Land classified as built in 2000 is blue, in 2010 is green and the difference between 2000 and 2022 is in purple. Land use patterns are spotty and inconsistently highlighted, with the masked layers failing to cover Landsat baselayer showing built-up land.
Because of this inconsistency in classifying land use across regions, two strategies would be ideal for future research: first, increasing the amount and variety of classifier training samples to better accommodate varying land types; second, running accuracy assessments and changing the classifier type itself to see if a different model would accommodate the samples more accurately.
In addition to these two strategies, tightening the geometric boundaries around each city – in which the area calculations are conducted – could help eliminate errant results that may be wrongly including (or excluding) significant amounts of land that impact its relevance. Across the nine areas, masked land from 2022 accounted for only 6.19% of the area of the bounds drawn around each city, with levels varying from city to city (for example, in Cozumel, masked land in the city accounted for 0.5% of the total bounds, which spanned the entire island; conversely, masked land in Veracruz accounted for over a third of the total pixel area within the bounds) and region to region. However, it has to be taken into account that the density between different regions is not the same, causing some historically well-developed and dense areas (Veracruz) to present more masked land than an area with distinctly and inherently higher vegetation (Tulum).
 Figure 4. The geometric bounds for Tulum (left) and Veracruz (right) highlight two very different area types, one highly vegetated (Tulum) and one that has been historically developed (Veracruz). Adjusting the bounds of both regions around existing developments could help more accurately capture the proportion of built to non-built land in a highly-vegetated region like Tulum, and adjusting the bounds to better highlight cities more distinctly can avoid over-counting land use change in areas like Veracruz.
That said, tourism within a city affects far more than just that city, and funds don’t stop at city or municipal boundaries. Better gauging the political boundaries of cities, as well as metropolitan areas, can, in concert with a stronger and well-trained classifier, create more accurate results to track change at a high level.
Ultimately, this study and research is just a step in a direction of understanding how the rate of development in different coastal tourism-heavy areas varies, which can lend insight into what kinds of economic and environmental drains may take place as a result. Some areas, like Playa Del Carmen, changed at a rapid rate relative to the other study areas, highlighting candidates for future, intensive study. While this tool does, on its face, have the ability to quantitatively assess the amount of pixel area change as well as, by extension, the rate of change of built-up land, it’s better served as a preliminary way to gauge areas of concern or interest, with further investigations diving deeper into individual cities and a wider array of metrics.
- Graciano, Juan Carlos, Manuel Ángeles, and Alba E. Gámez. “A Critical Geography Approach to Land and Water Use in the Tourism Economy in Los Cabos, Baja California Sur, Mexico.” Journal of Land Use Science 15, no. 2-3 (2019): 439–56. https://doi.org/10.1080/1747423x.2019.1699613.
- Murray, Grant. “Constructing Paradise: The Impacts of Big Tourism in the Mexican Coastal Zone.” Coastal Management 35, no. 2-3 (2007): 339–55. https://doi.org/10.1080/08920750601169600.
- Ortiz-Lozano, L., A. Granados-Barba, V. Solís-Weiss, and M.A. García-Salgado. “Environmental Evaluation and Development Problems of the Mexican Coastal Zone.” Ocean & Coastal Management 48, no. 2 (2005): 161–76. https://doi.org/10.1016/j.ocecoaman.2005.03.001.
- USGS. “MCD12Q1.006 Modis Land Cover Type Yearly Global 500M | Earth Engine Data Catalog | Google Developers.” Google. Google. Accessed May 14, 2022. https://developers.google.com/earth-engine/datasets/catalog/MODIS_006_MCD12Q1?hl=en#citations.
- –– “Landsat 7.” USGS. Accessed June 2, 2022. https://www.usgs.gov/landsat-missions/landsat-7