Welcome to "Data Slices", where imagination and information converge, inviting you to see the world through a new lens of data-driven artistry.


Introducing "Data Slices", a captivating mini visualization series crafted using the power of Python's matplotlib, seaborn, and other cutting-edge visualization libraries. Prepare to embark on a journey where the ordinary is transformed into the extraordinary through the art of data visualization. Each visualization in this series is meticulously curated to showcase the hidden beauty and fascinating insights that lie within seemingly mundane data. From visualizing the rhythmic patterns of rainfall to unraveling the intricacies of social media trends, "Data Slices" invites you to explore the captivating intersections of data and aesthetics.
20230617 - Tech Titans A Year of Stock Evolution


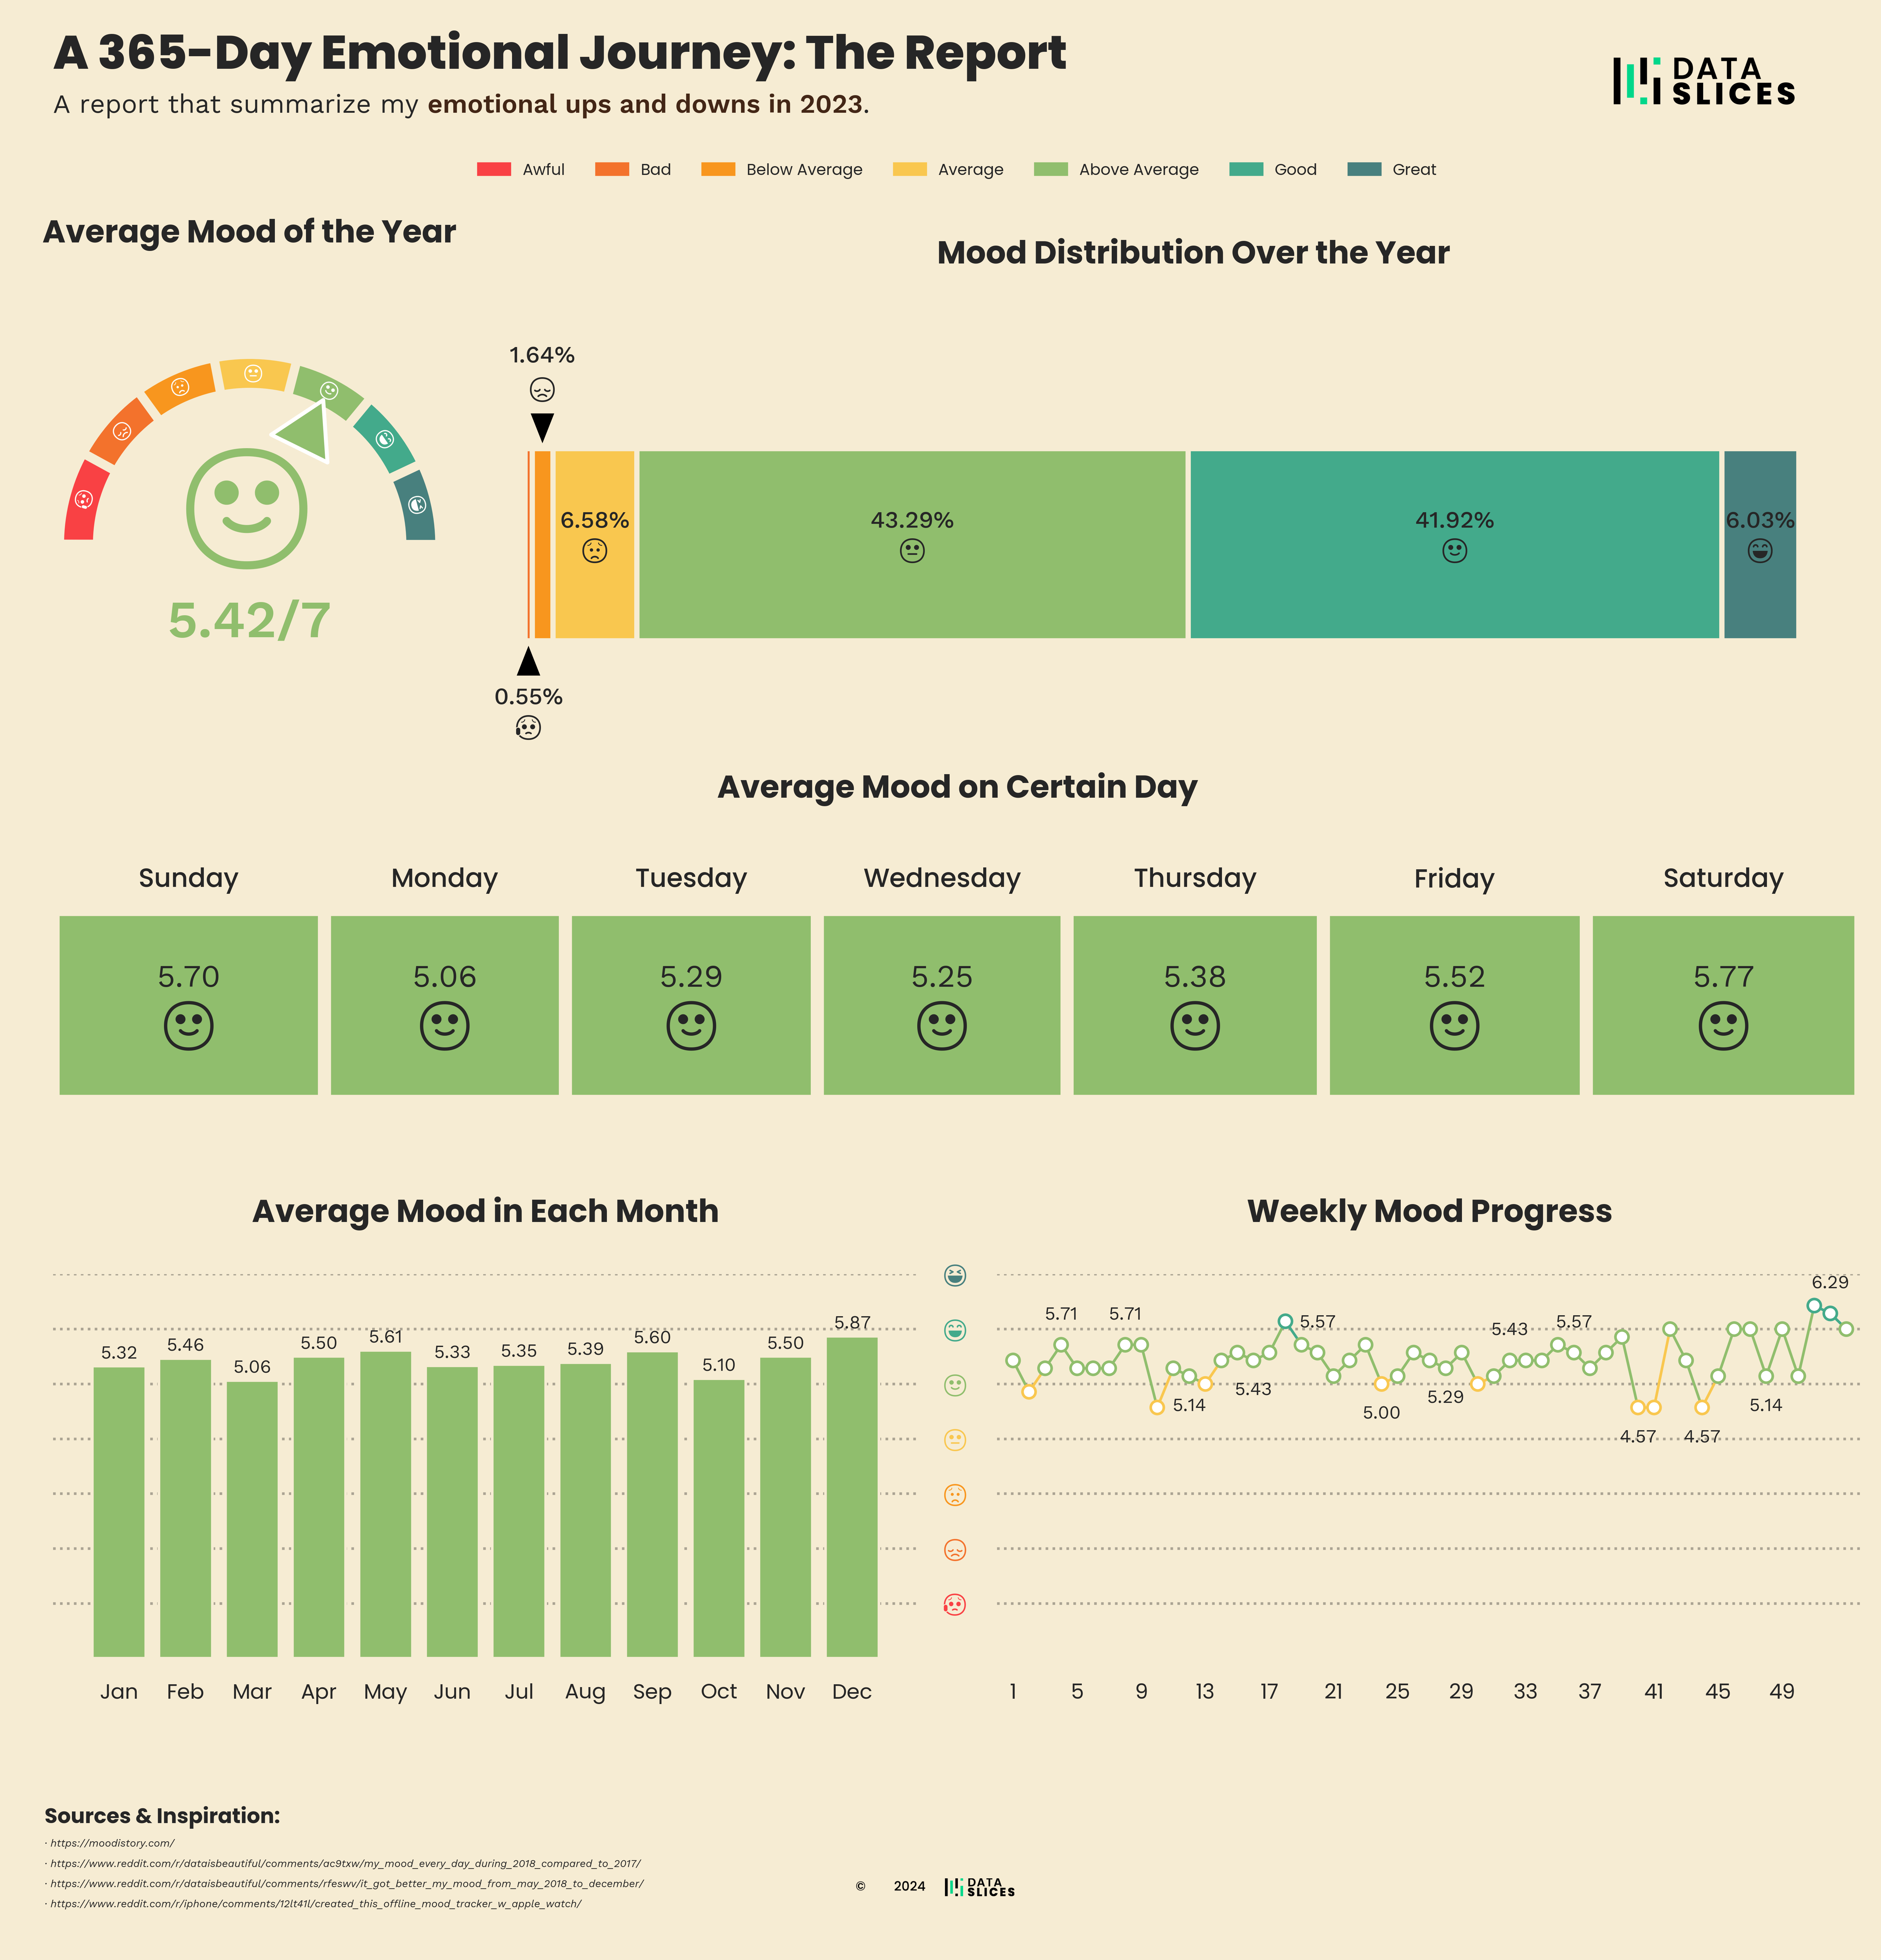
20231108 - A 365 Day Emotional Journey in Color

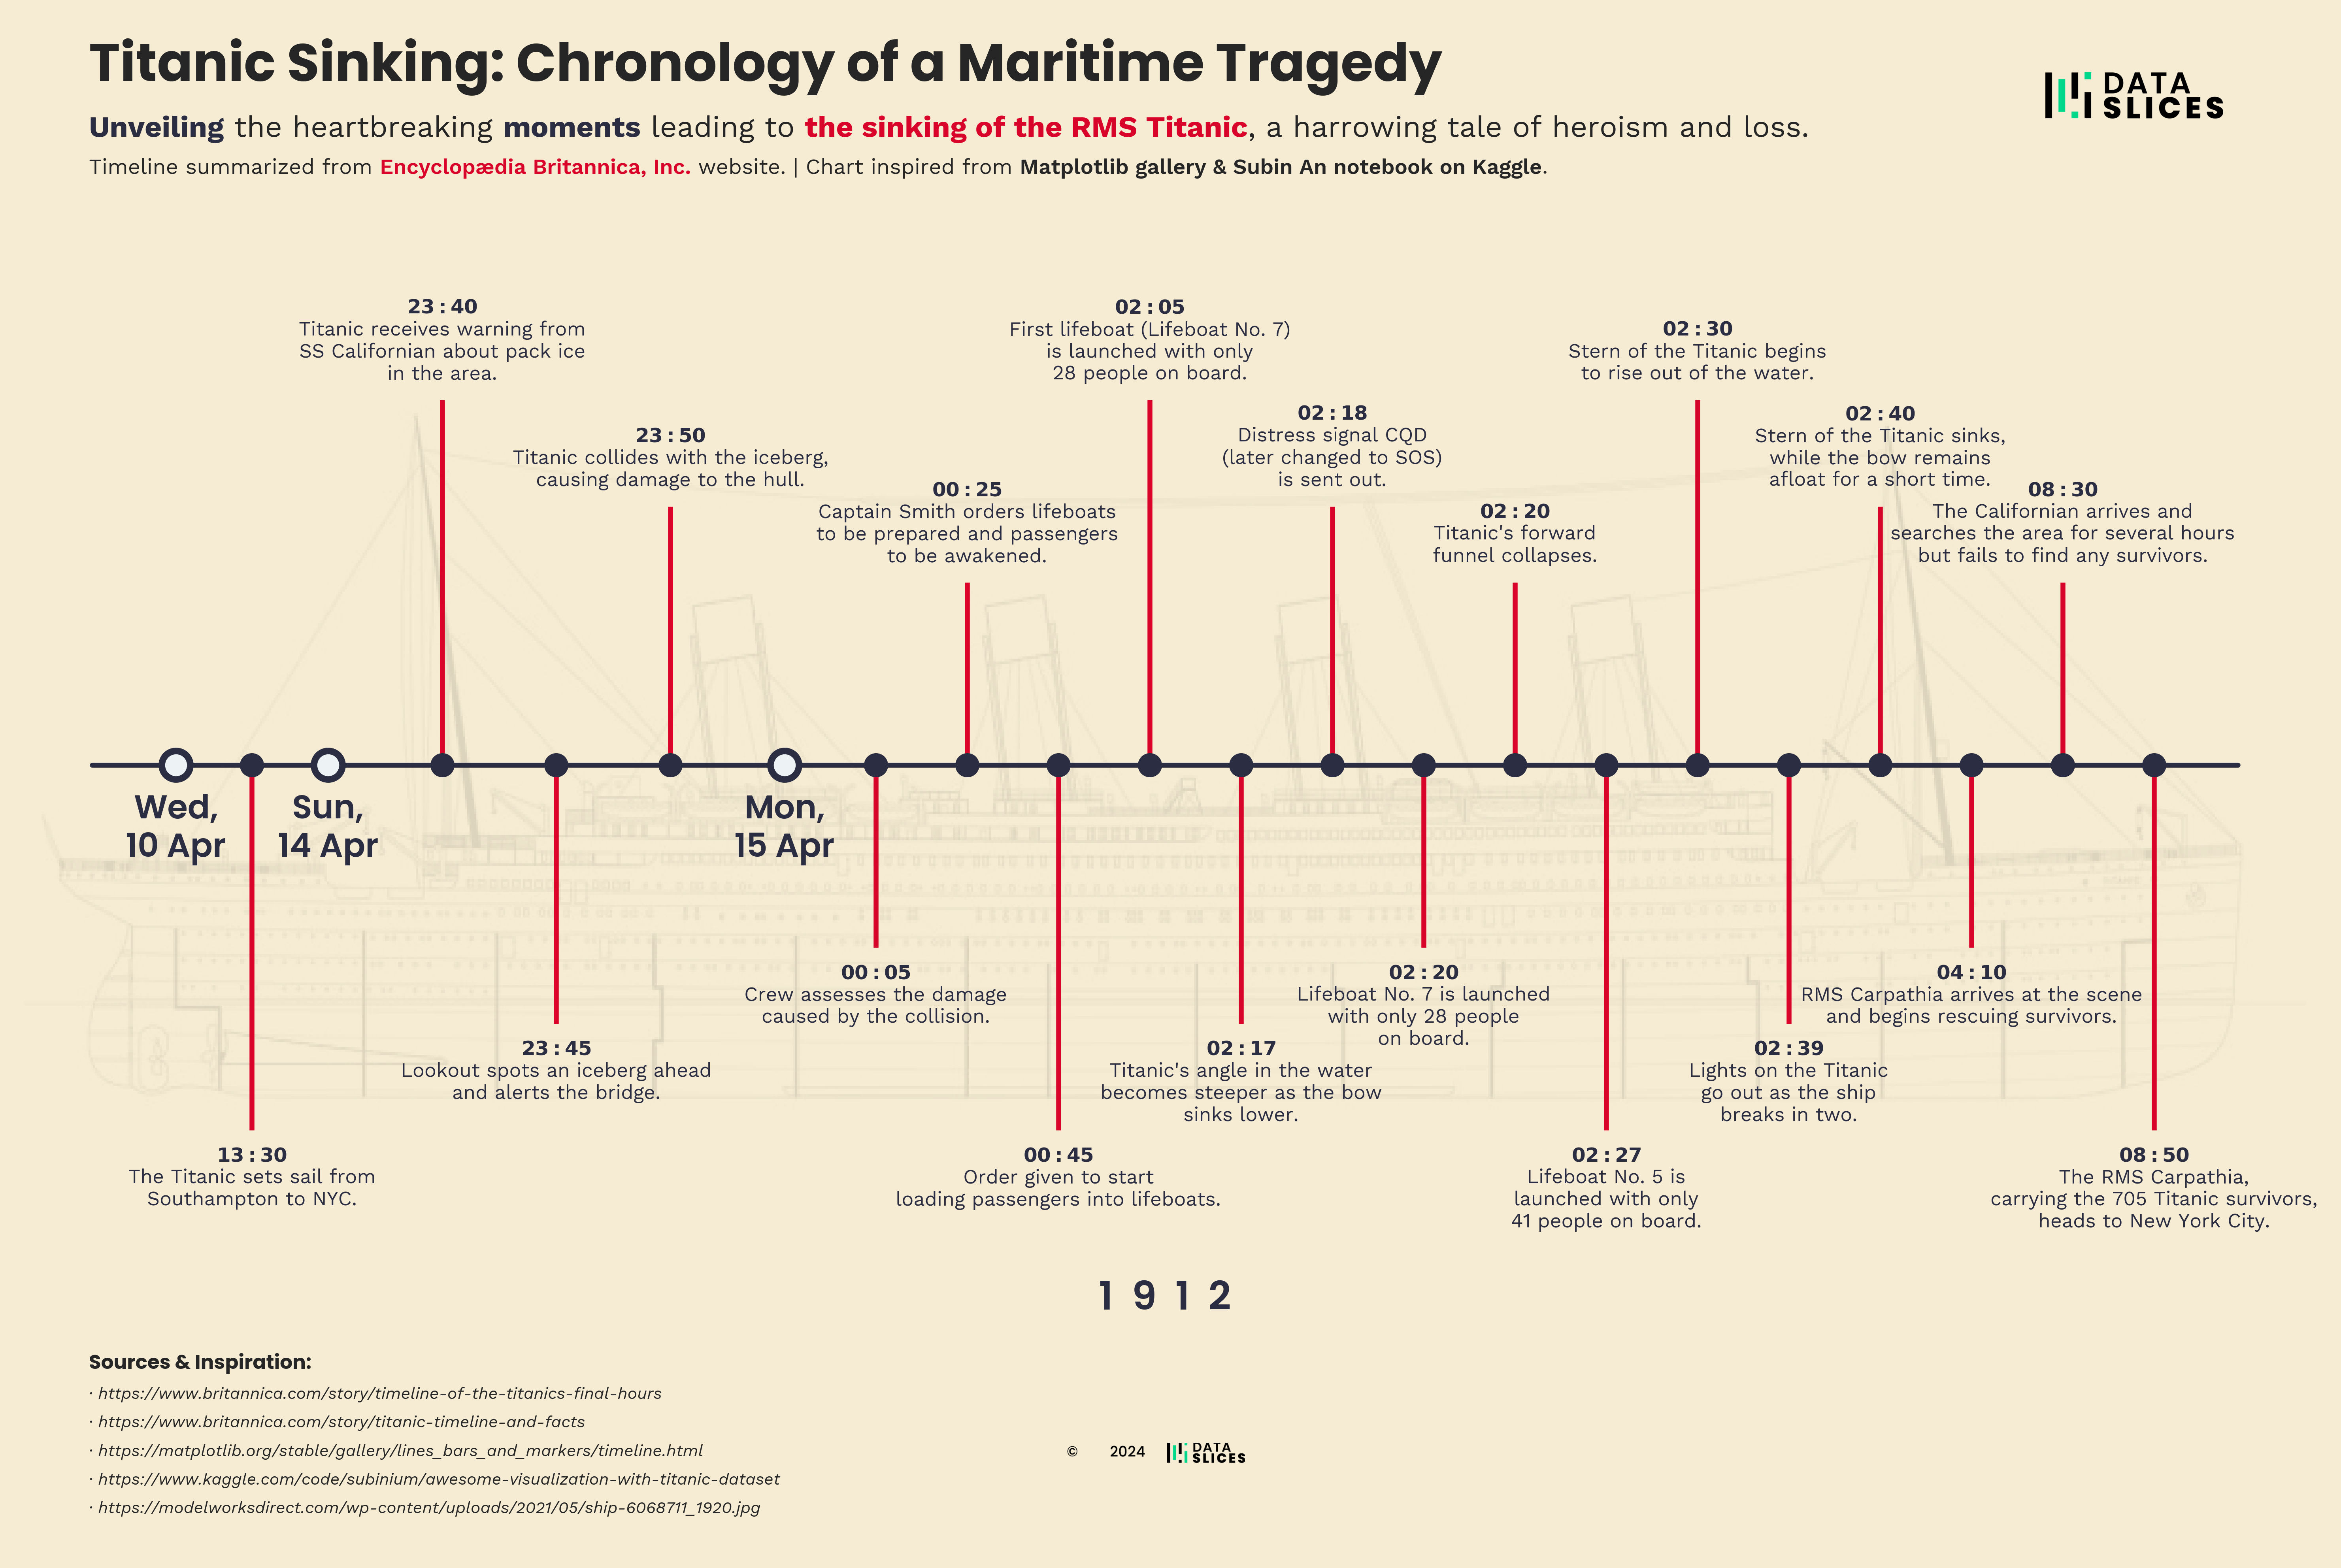
20240124 - Titanic Chronology
202401xx - SOON™
If this series has captured your interest, I would greatly appreciate your support in the form of stars on the repository. Additionally, you have the option to contribute through Ko-Fi, where every donation acts as a powerful motivator for me to enhance and expand the content I provide. Together, we can nurture this creative journey and continue to bring you captivating visualizations that inspire and delight.


