This repository is an experiment for working with Apache Jena:
Apache Jena (or Jena in short) is a free and open source Java framework for building semantic web and Linked Data applications. The framework is composed of different APIs interacting together to process RDF data.
The idea is to use a Triplestore to infer knowledge about Aviation data, using information from:
- Aircrafts
- Airports
- Carriers
- Flights
- Weather Stations
- ASOS / METAR Weather Data
Here are some example SPARQL queries for the dataset.
PREFIX xsd: <http://www.w3.org/2001/XMLSchema#>
PREFIX flight: <http://www.bytefish.de/aviation/Flight#>
PREFIX : <.>

CONSTRUCT { ?s ?p ?o }
WHERE {
  ?flight flight:tail_number "965UW" ;
    flight:flight_number "1981" ;
    flight:flight_date "2014-03-18T00:00:00"^^xsd:dateTime ;
    (<>|!<>)* ?s .
    ?s ?p ?o
}PREFIX xsd: <http://www.w3.org/2001/XMLSchema#>
PREFIX general: <http://www.bytefish.de/aviation/General#>
PREFIX flight: <http://www.bytefish.de/aviation/Flight#>
PREFIX weather: <http://www.bytefish.de/aviation/Weather#>
PREFIX : <.>
SELECT ?weather_timestamp ?predicate ?object
WHERE {
# Bind query variables:
BIND("2014-03-18T00:00:00"^^xsd:dateTime AS ?flight_date) .
BIND("965UW" AS ?tail_number) .
BIND("1981" AS ?flight_number) .
# Select the flight(s) with the bound variables:
?flight flight:tail_number ?tail_number ;
flight:flight_number ?flight_number ;
flight:flight_date ?flight_date ;
general:has_origin_airport ?origin .
# Get the Weather Station associated with the Airport:
?origin general:has_weather_station ?station .
# Get all predicates and objects for the Weather Station:
?weather general:has_station ?station ;
weather:timestamp ?weather_timestamp ;
?predicate ?object .
# But filter only for values of the given day:
FILTER( year(?weather_timestamp) = year(?flight_date)
&& month(?weather_timestamp) = month(?flight_date)
&& day(?weather_timestamp) = day(?flight_date))
}
ORDER BY ASC(?weather_timestamp)
LIMIT 1000To get all cancelled flights due to weather events, we have to query for the cancellation
code B as defined by the NTSB Airline On Time Performance Data:
PREFIX xsd: <http://www.w3.org/2001/XMLSchema#>
PREFIX general: <http://www.bytefish.de/aviation/General#>
PREFIX flight: <http://www.bytefish.de/aviation/Flight#>
PREFIX weather: <http://www.bytefish.de/aviation/Weather#>
PREFIX : <.>

SELECT ?tail_number ?flight_number ?flight_date ?scheduled_departure ?origin ?destination ?cancellation_code
WHERE {

  # Bind query variables:
  BIND("B" AS ?cancellation_code) .

  # Select the flight(s) with the bound variables:
  ?flight flight:cancellation_code ?cancellation_code ;
          flight:tail_number ?tail_number ;
          flight:flight_number ?flight_number ;
          flight:flight_date ?flight_date ;
          flight:scheduled_departure_time ?scheduled_departure ;
          general:has_origin_airport ?origin ;
          general:has_destination_airport ?destination .

}
ORDER BY ASC(?flight_date) ASC(?scheduled_departure)
LIMIT 1000
There is additional information given on an NTSB page called "Understanding the Reporting of Causes of Flight Delays and Cancellations", that discusses the delays due to weather:
In the FAQ it says:
How many flights were really delayed by weather?
A true picture of total weather-related delays requires several steps. First, the extreme weather delays must be combined with the NAS weather category. Second, a calculation must be made to determine the weather-related delays included in the "late-arriving aircraft" category. Airlines do not report the causes of the late-arriving aircraft but an allocation can be made using the proportion of weather related-delays and total flights in the other categories. Adding the weather-related delays to the extreme weather and NAS weather categories would result in weather's share of all flight delays.
So it may be neccessary to include additional datasets to get a true picture about delays.
Is my flight delayed? The plan is to analyze the Airline On Time Performance dataset, which contains:
[...] on-time arrival data for non-stop domestic flights by major air carriers, and provides such additional items as departure and arrival delays, origin and destination airports, flight numbers, scheduled and actual departure and arrival times, cancelled or diverted flights, taxi-out and taxi-in times, air time, and non-stop distance.
The data spans a time range from October 1987 to present, and it contains more than 150 million rows of flight informations. It can be obtained as CSV files from the Bureau of Transportation Statistics Database, and requires you to download the data month by month.
More conveniently the Revolution Analytics dataset repository contains a ZIP File with the CSV data from 1987 to 2012.
Is a flight delayed, because of strong winds, heavy rain or ice accretion? Many airports in the USA have so called Automated Surface Observing System (ASOS) units, that are designed to serve aviation and meterological operations. The NOAA website writes on ASOS weather stations:
Automated Surface Observing System (ASOS) units are automated sensor suites that are designed to serve meteorological and aviation observing needs. There are currently more than 900 ASOS sites in the United States. These systems generally report at hourly intervals, but also report special observations if weather conditions change rapidly and cross aviation operation thresholds.
ASOS serves as a primary climatological observing network in the United States. Not every ASOS is located at an airport; for example, one of these units is located at Central Park in New York City. ASOS data are archived in the Global Surface Hourly database, with data from as early as 1901.
The Iowa State University hosts an archive of automated airport weather observations:
The IEM maintains an ever growing archive of automated airport weather observations from around the world! These observations are typically called 'ASOS' or sometimes 'AWOS' sensors. A more generic term may be METAR data, which is a term that describes the format the data is transmitted as. If you don't get data for a request, please feel free to contact us for help. The IEM also has a one minute interval dataset for Iowa ASOS (2000-) and AWOS (1995-2011) sites. This archive simply provides the as-is collection of historical observations, very little quality control is done. "M" is used to denote missing data.
Daryl Herzmann of the Iowa State University provides a great Python script to download the ASOS / AWOS data from the Webservices, which is available at:
Is a flight delayed because of aircraft or engine problems? This is an interesting question, that you might want to know about. And there is a database maintained by the FAA, which contains the data we need to answer the question:
The dataset is described as:
The archive file contains the:
- Aircraft Registration Master file
- Aircraft Dealer Applicant file
- Aircraft Document Index file
- Aircraft Reference file by Make/Model/Series Sequence
- Deregistered Aircraft file
- Engine Reference file
- Reserve N-Number file
Files are updated each federal business day. The records in each database file are stored in a comma delimited format (CDF) and can be manipulated by common database management applications, such as MS Access.
I have used some Excel magic to join the several files and build a view on the data, that could be parsed easily:
From the Management Console at http://localhost:3030/dataset.html we can get the number of triples by using
the button count triples in all graphs. This runs the following query on the Fuseki Server:
[2019-11-14 19:36:20] Fuseki     INFO  [12] GET http://localhost:3030/aviation/query?query=select+(count(*)+as+%3Fcount)+%7B%3Fs+%3Fp+%3Fo%7D
[2019-11-14 19:36:20] Fuseki     INFO  [12] Query = select (count(*) as ?count) {?s ?p ?o}
[2019-11-14 19:45:12] Fuseki     INFO  [12] 200 OK (531.933 s)
[2019-11-14 19:45:12] Fuseki     INFO  [8] 200 OK (551.934 s)
We can see, that this operation took almost 10 minutes to execute and it yields the following results:
graph name: default graph
triples: 981240370
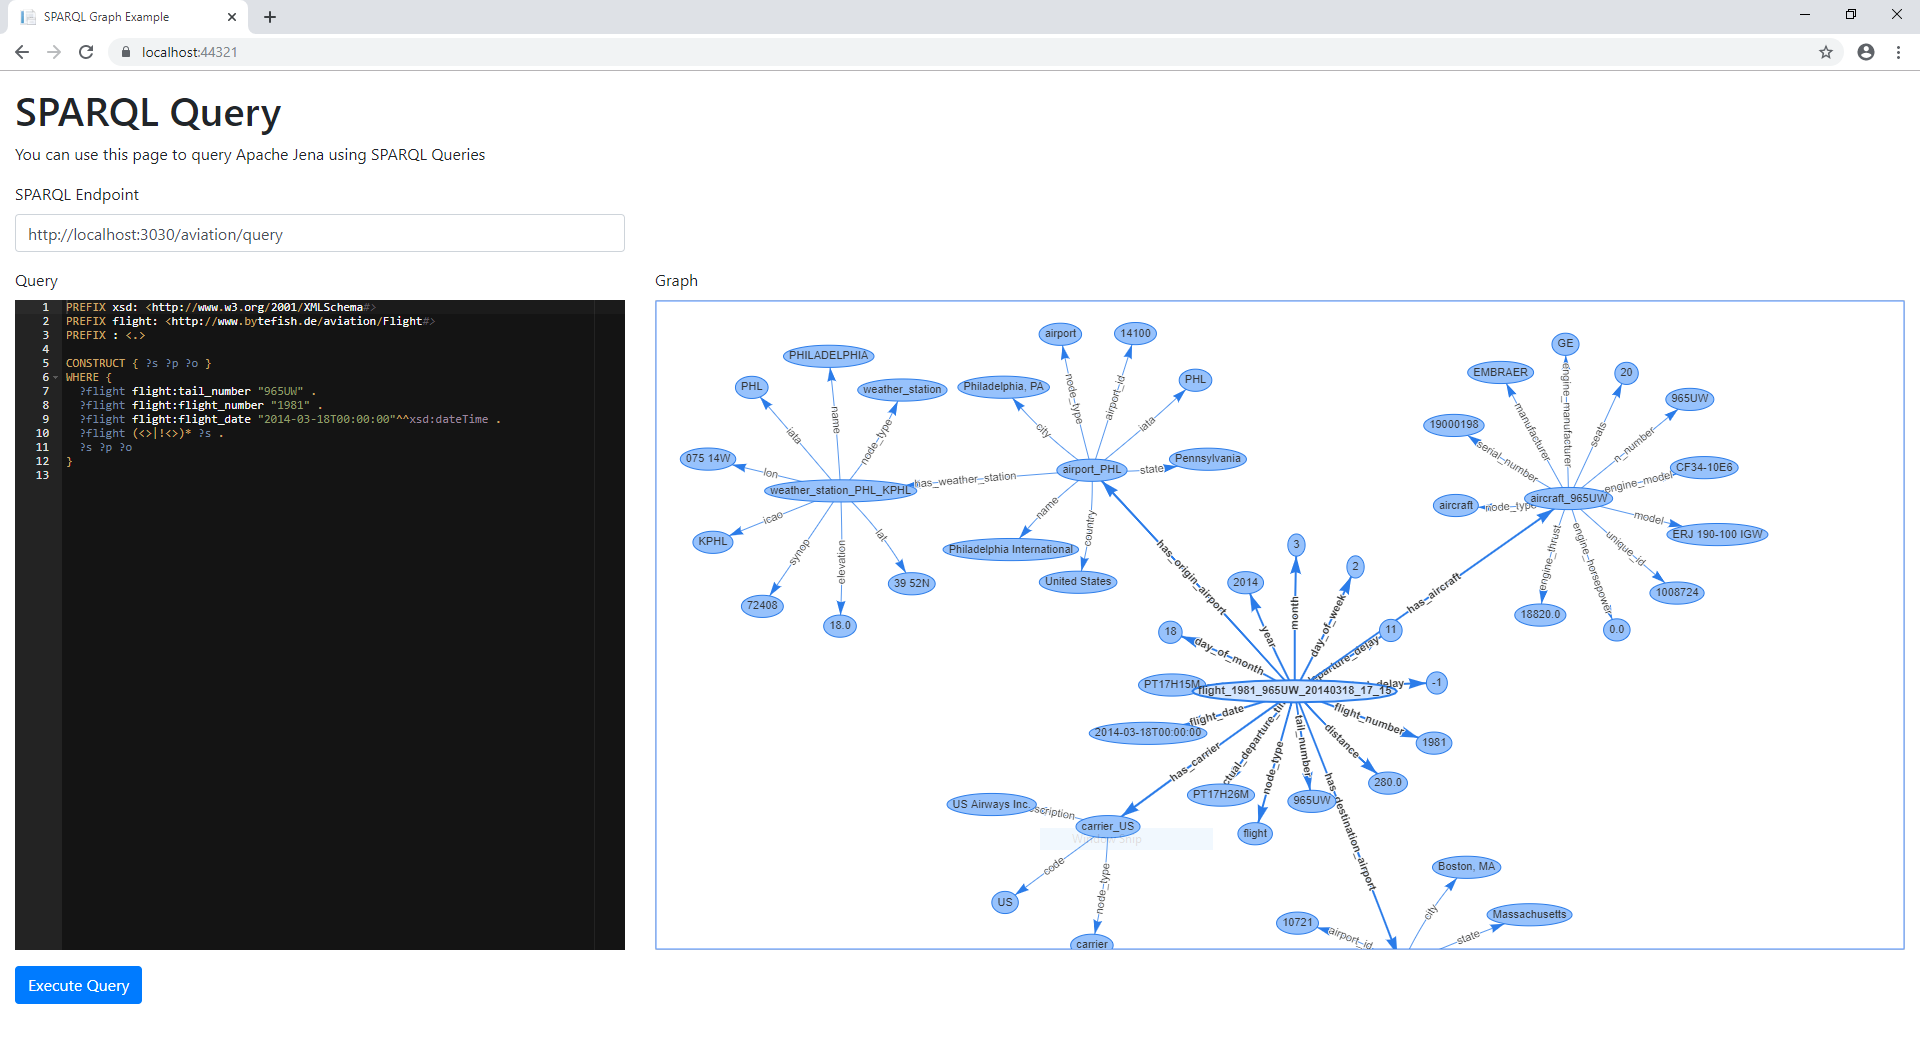
I have written a tiny ASP.NET Core application, that takes a SPARQL Query and writes the results
as a vis-network Graph. It is very experimental and handles only very basic CONSTRUCT / DESCRIBE
queries.
In the example below, I am querying for a very specific flight with Tail Number N965UW, Flight Number "1981"
on the day 2014-03-18. I am still learning SPARQL, so there might be better ways to express it:
PREFIX xsd: <http://www.w3.org/2001/XMLSchema#>
PREFIX flight: <http://www.bytefish.de/aviation/Flight#>
PREFIX : <.>

CONSTRUCT { ?s ?p ?o }
WHERE {
  ?flight flight:tail_number "N965UW" .
  ?flight flight:flight_number "1981" .
  ?flight flight:flight_date "2014-03-18T00:00:00"^^xsd:dateTime .
  ?flight (<>|!<>)* ?s .
  ?s ?p ?o
}
And this query yields the flight and all nodes reachable from the flight: