More info on the R geofacet package
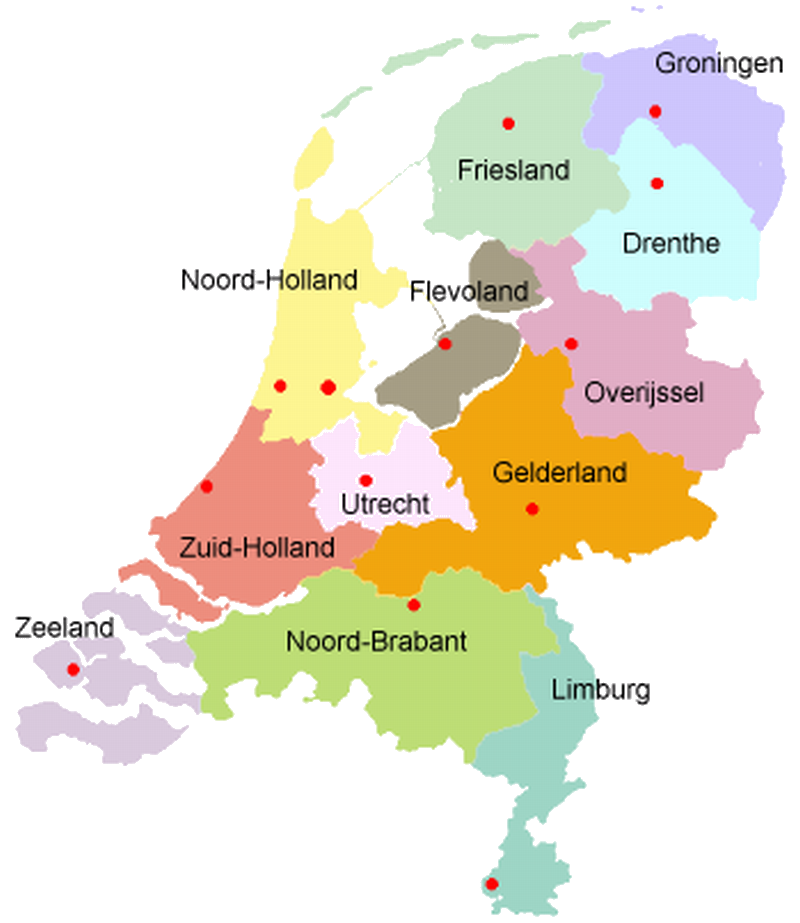
The grid is defined based on a map for The Netherlands that can be found on Wikipedia.
This repo contains an example of the usage of this geafacet grid. It presents some plots that show the developement of housing prices over the last two decenia. The data were obtained from Statistics Netherlands CBS.
Some base statistics about the Dutch provinces can be found on Wikipedia.