The COVID-19 Vaccination Analysis Pipeline (CVAP) is a modular analytical pipeline designed to consolidate, analyze, and disseminate COVID-19 vaccine implementation data across all countries, areas, and territories for use by the global community. It is produced and maintained by the CoVDP Data, Analytics, and Monitoring (DAM) team and is hosted on GitHub.
Since the beginning of the COVID-19 vaccine rollout, up to date COVID-19 vaccine implementation data have been needed to inform operational and policy decision-making at all levels. Under the COVAX Country Readiness & Delivery (CRD) workstream, a PowerBI-based precursor to the current CCAP was developed to routinely centralize, homogenize, and overlay various data from along the vaccine introduction ‘value chain’. Needing additional flexibility and greater security, the precursor solution was translated into an R-based analytical pipeline, now known as the CCAP, in December 2021.
The CCAP was first committed to GitHub end of January 2022. The original pipeline was a monolith application, incorporating data relating to daily vaccination rate, coverage, and supply secured & received. Soon after the first commit, the CCAP was thematically expanded to include analysis of coverage in high & highest risks groups and allocated external financing for vaccine delivery.
Over the course of the first quarter of 2022, the CCAP was transitioned from a monolith pipeline to a modular pipeline, sectioned according to thematic data divisions, orchestrated by a central run script. This transition permitted for greater pipeline stability, as each module could be debugged, deployed, and managed independently of the rest, and greater flexibility, allowing facile introduction of new functionalities.
Following adoption of the new modular architecture, inputs to the pipeline were automated to the greatest extent possible, privileging API data connections over local data file ingestion. Further, additional pieces of key data analysis, notably cleaning of ingested administration data and direct calculation of daily vaccination rates, were reappropriated from collaborating partners to enable greater quality control and to shorten debugging timelines.
Through the above development, the CCAP has become a main pillar of the global data system for the consolidation, analysis, and dissemination of COVID-19 vaccination data. Data produced by the CCAP flow throughout WHO, UNICEF, Gavi, and other partners and inform decisions ranging from vaccine dose allocations and vaccine demand planning to the assignment of technical assistance and financing. Data produced by the CCAP are made publicly available via the CoVDP’s Information Hub.
The CCAP is written in R, with the exception of one module (dvr), which is written in Python. It is hosted in a private GitHub repository.
- Ensure R is installed on your machine. If not installed, download the software here.
- Install R Studio or Visual Studio Code.
- The R extension will be needed to run R in VS Code; get it here.
To access the CCAP GitHub repository, contact Donald Brooks (brooksd@who.int).
Design principles (rules) abided by while building & contributing to this architecture include:
- Separation of Concerns (SoC) Each distinct section is separated to address different individual concerns.
- Don't Repeat Yourself (DRY) Minimal to no repetition of software patterns are observed. The system is designed with a single, authoritative and unambiguous representation for every piece of knowledge.
- Keep it short and simple (KISS) Simple design to building the architecture is observed.
- SOLID The design principles used are dedicated to making software designs flexible, maintainable, and flexible.
| Path | Content |
|---|---|
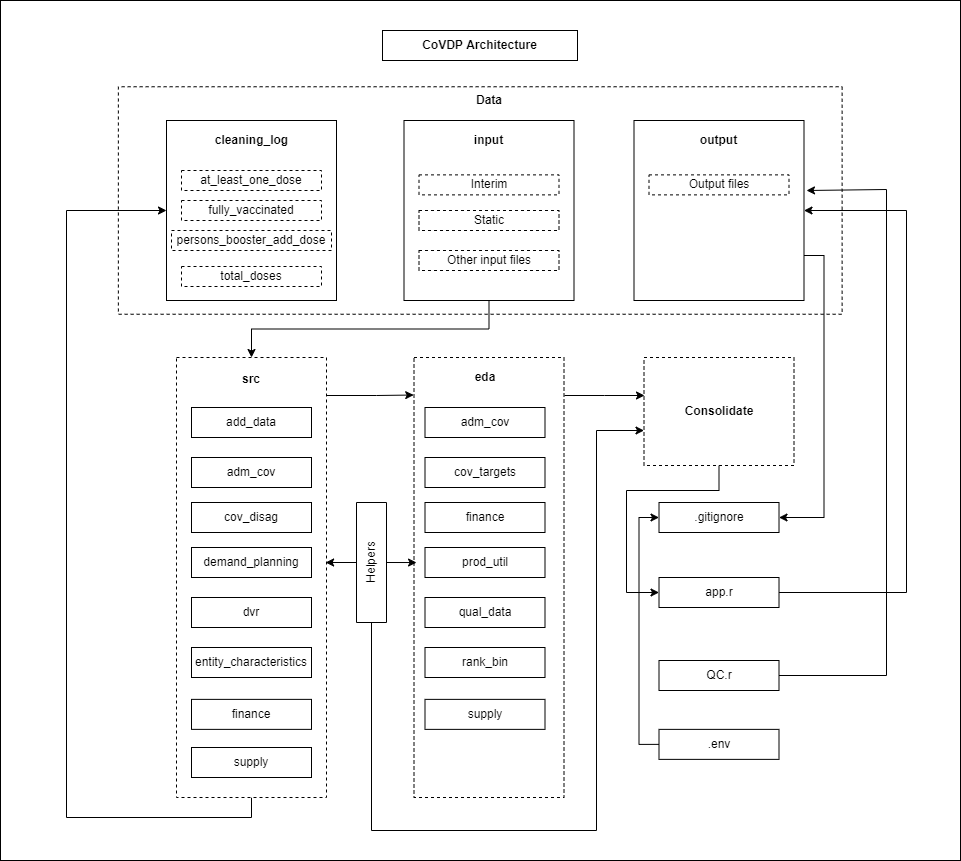
| consolidate | module that consolidates all data from the CCAP. |
| data | data folder holding all data ingested and produced in the CCAP. |
| data/cleaning_log | folder containing all the log of cleaning done on 1 dose, fully vaccinated, boosters and total doses vaccines. |
| data/input | input files ingested into pipeline. |
| data/input/interim | temporary input files produced and consumed during CCAP run. |
| data/input/static | input files that do not change every so often. |
| data/output | All output files generated after the CCAP run. |
| src | Extraction, transformation and load (ETL) folder handling all ETL for different sections of the CCAP. |
| src/add_data | Extraction, ingestion and transformation of base smartsheet & WHO dashboard. |
| src/adm_cov | Extraction, ingestion and transformation of administration coverage data (vaccines). |
| src/cov_disag | Extraction, ingestion and transformation of coverage disagregation data from WIISEMart API. |
| src/demand_planning | Extraction, ingestion and transfomation of demand planning data. |
| src/dvr | Extraction, ingestion and transformation of daily vaccination rate data. |
| src/entity_characteristics | Extraction, ingestion and transforation of base entity details, UN population (UNPOP) and health care workers (HCW) data. |
| src/finance | Extraction, ingestion and transformation of finance data from UNICEF. |
| src/supply | Extraction, ingestion and transformation of vaccine supply data from IMF vaccine tracker and UNICEF market dashboard. |
| eda | Exploratory data analysis (EDA) folder containing different modules handling EDA for different CCAP sections. |
| eda/adm_cov | EDA and consolidation of administrative coverage data. |
| eda/cov_targets | EDA and consolidation of coverage target data. |
| eda/finance | EDA of finance data consolidation. |
| eda/prod_util | EDA and consolidation of product utilization data. |
| eda/rank_bin | Grouping and ranking of data. |
| eda/supply | EDA of supplies data consolidation. |
| helpers | Folder containing different helper functions which are repeatedly & frequently used in different sections within the CCAP. |
| .env | Configuration variables from the .env file containing API keys from WIISEMart. |
| .gitignore | file containing any item to be excluded from online GitHub repository. |
| app.r | Main run file for CoVDP pipeline. Includes all consolidated functions used within the CCAP and one main function that writes all outputs to one Excel document. |
| QC.r | quality check script to compare current week outputs from previous week outputs. |
- All modules contain run files with run functions named after the specific module.
- Each module can be tested by calling the run function at the end of the script e.g., run_add_data() for the add_data module.
- To collectively run all modules at once, run app.R file.
- Ensure static dates are changed for each new week, with the exception of t70_deadline.
-
All libraries/packages needed to run the R code.
-
Static global variable dates.
- refresh_date: date which one runs the pipeline.
- dataset_date (sec_date): date reported on the first tab from IMF dataset.
- del_date: date reported from first tab from UNICEF'S Delivery tables sent weekly via mail.
- t70_deadline: WHO set timeline to achieve 70% target coverage.
-
Paths to helper functions.
-
Paths to ETL run files.
-
Environment variables from each ETL module.
-
Paths to EDA run files.
-
Environment variables for each EDA module.
-
Path to consolidate module.
-
Exporting analyzed data to excel using write_xlsx package.
- Preparation of monthly time series data view across supply secured, supply received, coverage, daily vaccination rate, financing, and coverage in high-risk groups.