


MRI T2 decay curve simulation with imperfect refocusing pulses (non-180 degrees)
- Free software: GNU General Public License v3
- Documentation: https://t2stimulate.readthedocs.io.
A T2 multi-echo decay curve in MRI is traditionally modeled as a decaying exponential with one or more exponential components. This assumes the refocusing pulse flip angle is at or near 180 degrees, and, if not, that other gradients are added in as spoilers to remove the signal from stimulated echoes.
The stimulated echoes were modeled many years ago in a paper (ref) and were then implemented in simulation code and were found to be sufficient to use for fitting multi-echo decay curves from non-180 degree refocussing pulse sequences.
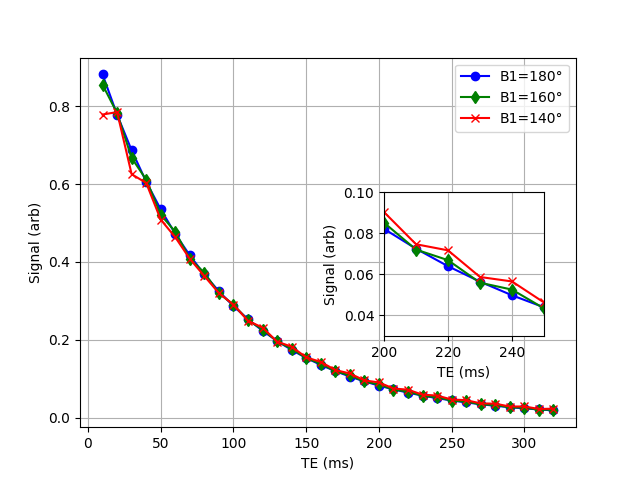
Below is an example of three curves of a 32 echo MRI Pulse sequence with TE=10ms and refocusing pulse flip angles of 180 degrees, 160 degrees and 140 degrees. The code was:
import matplotlib.pyplot as plt
import numpy as np

from t2stimulate.simulate import stimulate

# Set a couple of parameters
num_echoes = 32
tau = 5
T1 = 1000

te = 2*tau*np.arange(1, num_echoes+1)

curve_140 = stimulate(alpha=140 / 180 * np.pi, num_echoes=num_echoes, T1=450, T2=80, tau=tau)
curve_160 = stimulate(alpha=160 / 180 * np.pi, num_echoes=num_echoes, T1=450, T2=80, tau=tau)
curve_180 = stimulate(alpha=180 / 180 * np.pi, num_echoes=num_echoes, T1=450, T2=80, tau=tau)

plt.figure(1)
plt.clf()

plt.plot(te, curve_180, 'bo-')
plt.plot(te, curve_160, 'gd-')
plt.plot(te, curve_140, 'rx-')
plt.xlabel('TE (ms)')
plt.ylabel('Signal (arb)')
plt.grid('on')

plt.legend(['B1=180°', 'B1=160°', 'B1=140°'])

plt.axes((0.6, 0.3, 0.25, 0.3))

plt.plot(te, curve_180, 'bo-')
plt.plot(te, curve_160, 'gd-')
plt.plot(te, curve_140, 'rx-')
plt.xlabel('TE (ms)')
plt.ylabel('Signal (arb)')
plt.grid('on')
plt.xlim((200,250))
plt.ylim((0.03, 0.1))

plt.show()
And the resulting plot:
- TODO
This package was created with Cookiecutter and the audreyr/cookiecutter-pypackage project template.