A data model and a viewer for carbon footprint scenarios. This toolkit makes it easy to create, share and compare emission scenarios. Its purpose is to improve data quality and transparency in the field of carbon footprint quantification.
The main features of the data model are:
- A universal data scheme to model carbon emission scenarios, split by scopes, consumer components and energy sources
- A modular structure which allows for nested scenarios that can be explored and modified at different levels of detail
- Support to back consumption and emission details with reference sources for better transparency

The main features of the viewer are:
- Automated unit conversion and common emission type detection to avoid data conversion errors
- Editable input fields for quantities to quickly test the effect of different settings
- Possibility to include different data sources for consumer components and energy sources
- One-click data export in the form of file download and scenario sharing via encoded URL
- Easy deployment: No-deployment using encoded URLs, or as serverless application (i.e. on GitHub)
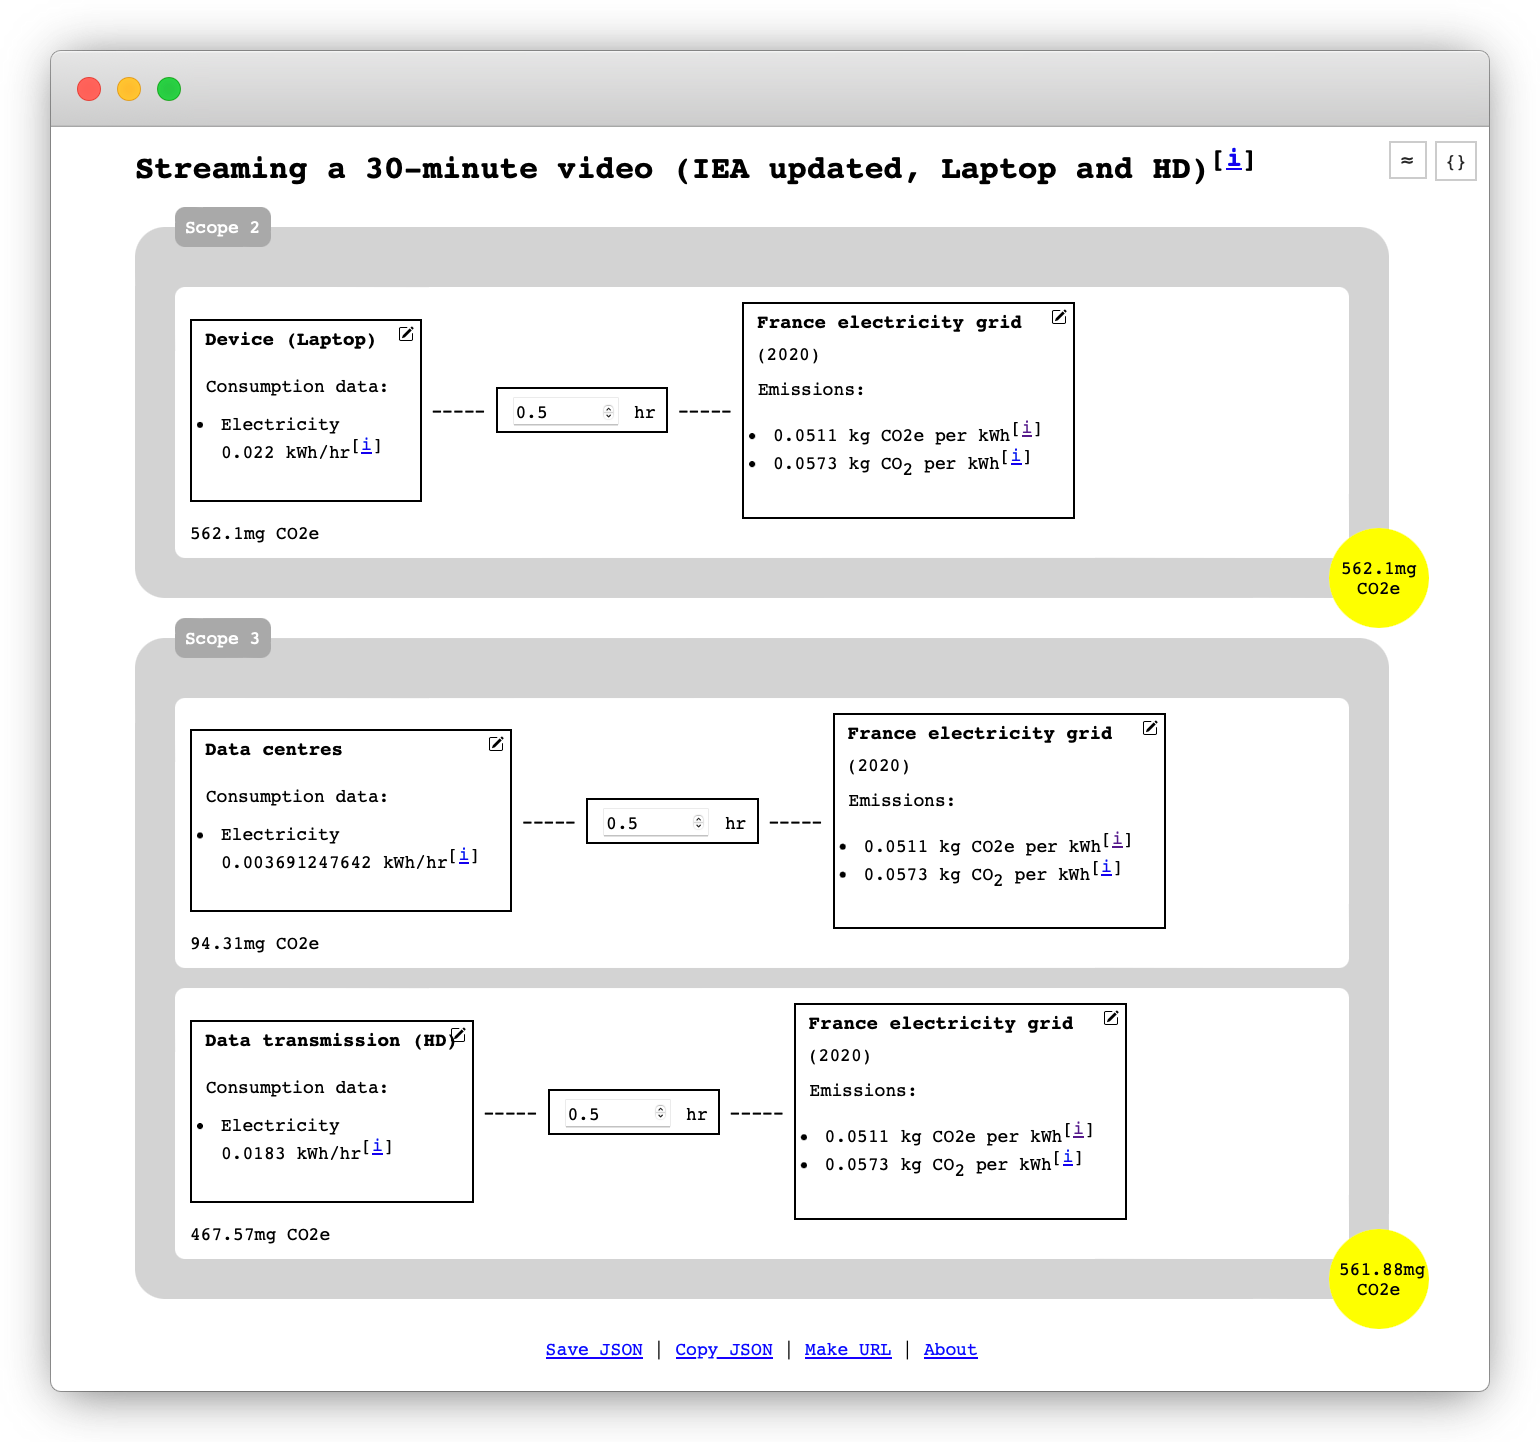
The viewer renders the scenario data which is either stored in a JSON file that is hosted on the server, or it is embedded in the URL.
Details on consumption and emissions can be toggled by clicking on the respective title. If a data source was included, consumer components
or energy sources can be changed by clicking the pencil icon ![]() . The total of the emissions per scope is shown in the yellow circle on the bottom right. It is updated instantly when settings in the scenario change. The emissions of nested scenarios are calculated recursively. They can be zoomed into by clicking on their links.
. The total of the emissions per scope is shown in the yellow circle on the bottom right. It is updated instantly when settings in the scenario change. The emissions of nested scenarios are calculated recursively. They can be zoomed into by clicking on their links.
Example scenarios:
- Streaming a 30-minute video [IEA updated, UK] (source)
- Streaming a 30-minute video [IEA updated, Laptop and HD] (source)
- Singapore (SIN) to Paris (CDG) round-trip (source)
- Nested sample of personal carbon footprint (source)
- Cargo ship emissions portfolio (source)
- Monthly operation of ChatGPT (source)
There are two ways to compose new scenarios: Either by customizing an existing scenario in the viewer and exporting the new setting, or by writing the data structure formatted in JSON from zero.
Use an existing scenario and update the quantities, consumer components and energy sources (as described above). When done, export the scenario using one of the links on the bottom of the page:
- "Save JSON" downloads the scenario as JSON file to your computer
- "Copy JSON" downloads the scenario with a new random identifier to your computer
- "Make URL" encodes the scenario within a URL you can use to share publicly publish it
Create a new JSON file following the data scheme. For example:
{
  "title": "Mobility",
  "scopes": [
    {
      "level": "Scope 1",
      "description": "'on-site' direct emissions",
      "list": [
        {
          "type": "component",
          "consumer": {
            "name": "Volkswagen Golf (2014)",
            "description": "Engine ID 45, 4 cylinders, Manual 6-spd",
            "consumptions": {
              "diesel": {
                "value": "0.0735046875",
                "unit": "l",
                "base_unit": "km",
                "reference_url": "https://www.fueleconomy.gov/"
              }
            }
          },
          "quantity": "10000",
          "quantity_unit": "km",
          "source": {
            "name": "Gas/Diesel oil",
            "type": "diesel",
            "description": "",
            "emissions": {
              "co2e": {
                "value": "3.25",
                "unit": "kg",
                "base_unit": "l",
                "reference_url": "https://bilans-ges.ademe.fr/documentation/UPLOAD_DOC_EN/index.htm?new_liquides.htm"
              }
            }
          }
        }
      ]
    }
  ]
}
Assign a random identifier as file name and upload it to the "scenarios" folder of the application. Load the scenario by providing the identifier (without the .json file extension) as id parameter in the URL. Example: index.html?id=scenario-95e1ade0-033c-40de-b30d-4e62f4723254
The benchmark view renders a bar chart for two or more hosted scenarios identified in the URL by their ids, like benchmark.html?ids[]=scenario-1&ids[]=scenario-2.
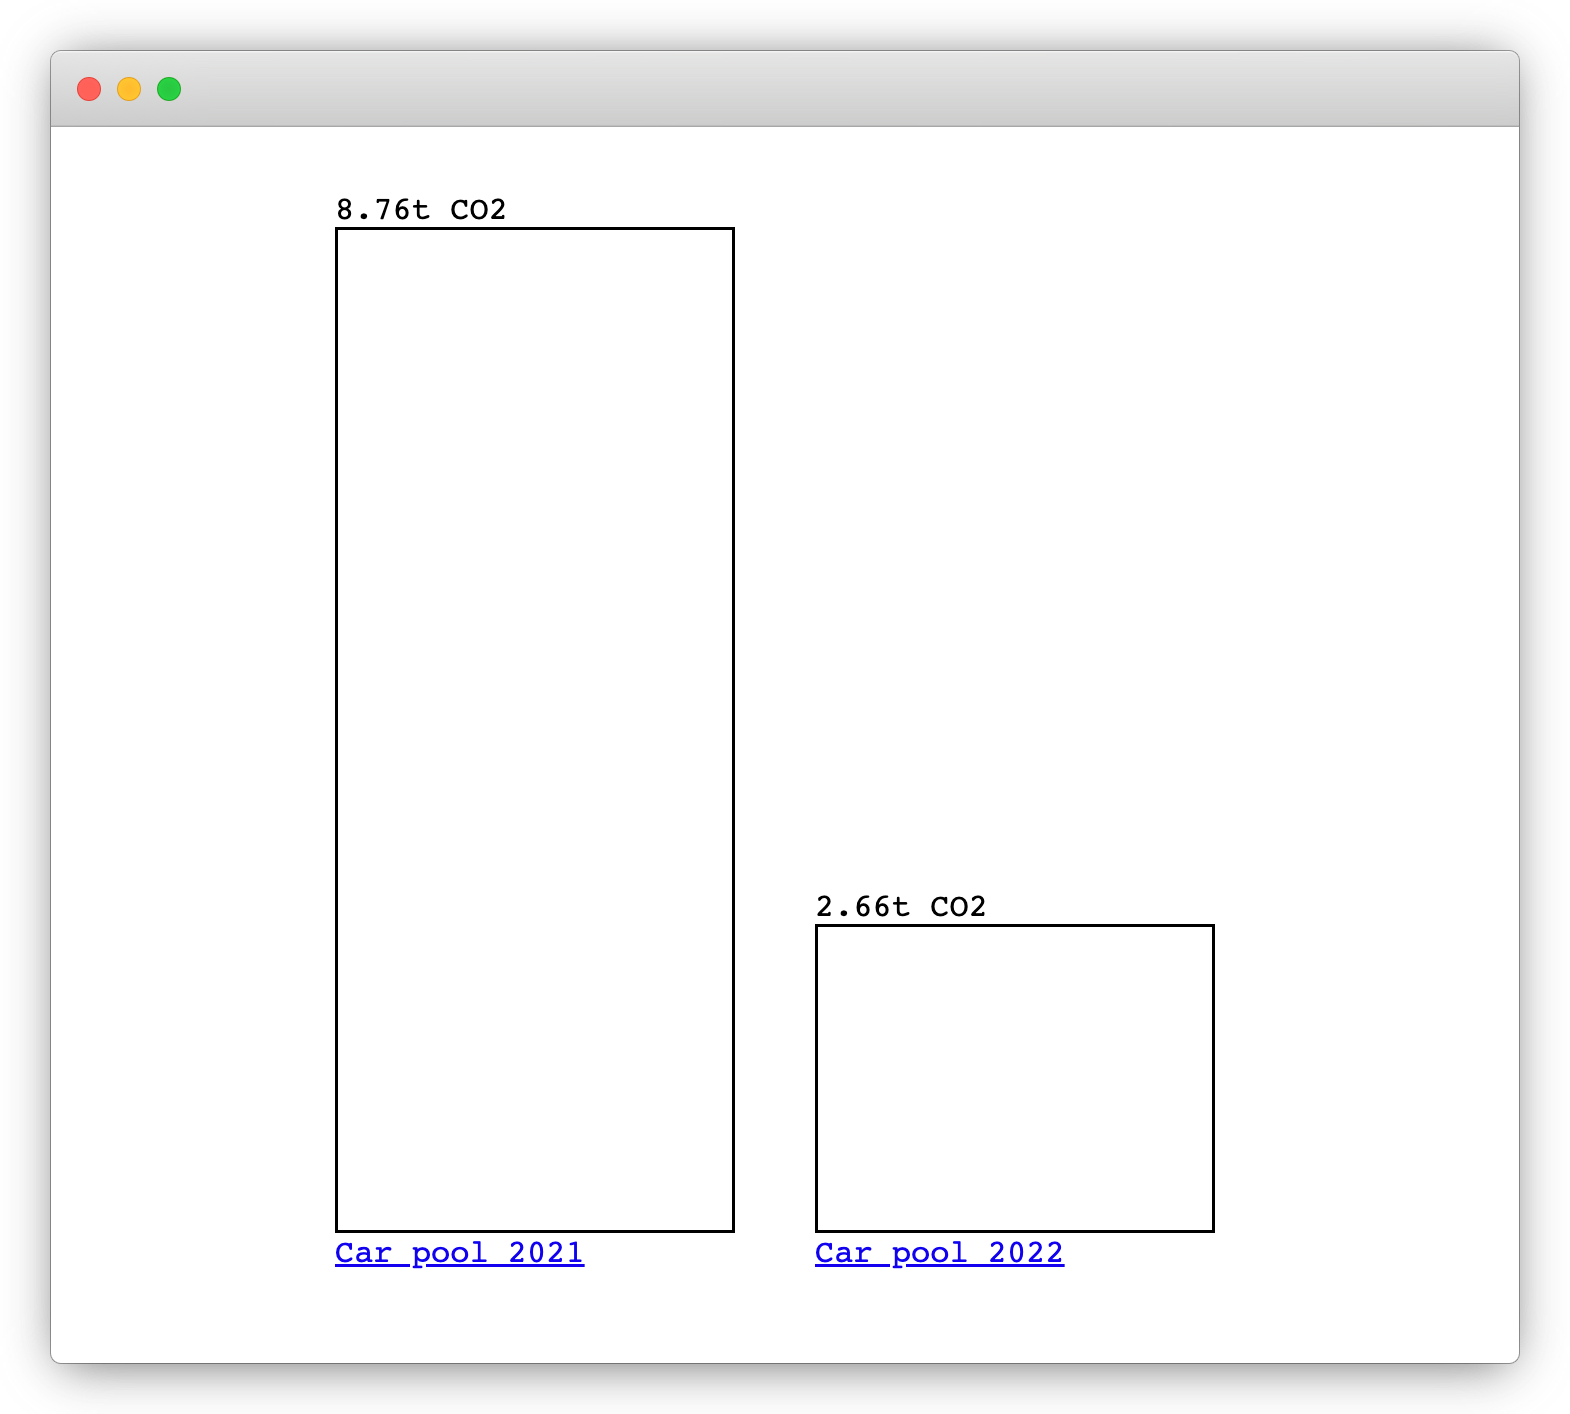
Benchmark example: 2021 vs. 2022 car pool comparison
This is a fully functional prototype, more features are in the planning. Any feedback is welcome.
B. Ruf and M. Detyniecki, "Open and Linked Data Model for Carbon Footprint Scenarios", 7th International Conference on Renewable Energy and Conservation (ICREC), 2022.
I. D'Aramon, B. Ruf, M. Detyniecki, "Assessing Carbon Footprint Estimations of ChatGPT", 8th International Conference on Renewable Energy and Conservation (ICREC), 2023.
B. Ruf, Félix Mortas, M. Detyniecki, "Transparent and Human-centered Carbon Footprinting", 42nd ACM Conference on Human Factors in Computing Systems (CHI), Workshop on Sustaining Scalable Sustainability, 2024.
Copyright (c) Boris Ruf
Permission is hereby granted, free of charge, to any person obtaining a copy of this software and associated documentation files (the "Software"), to deal in the Software without restriction, including without limitation the rights to use, copy, modify, merge, publish, distribute, sublicense, and/or sell copies of the Software, and to permit persons to whom the Software is furnished to do so, subject to the following conditions:
The above copyright notice and this permission notice shall be included in all copies or substantial portions of the Software.
THE SOFTWARE IS PROVIDED "AS IS", WITHOUT WARRANTY OF ANY KIND, EXPRESS OR IMPLIED, INCLUDING BUT NOT LIMITED TO THE WARRANTIES OF MERCHANTABILITY, FITNESS FOR A PARTICULAR PURPOSE AND NONINFRINGEMENT. IN NO EVENT SHALL THE AUTHORS OR COPYRIGHT HOLDERS BE LIABLE FOR ANY CLAIM, DAMAGES OR OTHER LIABILITY, WHETHER IN AN ACTION OF CONTRACT, TORT OR OTHERWISE, ARISING FROM, OUT OF OR IN CONNECTION WITH THE SOFTWARE OR THE USE OR OTHER DEALINGS IN THE SOFTWARE.