Central Connecticut State University Senior Capstone Project
MobiVision is a fully automated device/application which tracks and displays how safely you've been driving. Simply plug the device in and start driving and you'll see the results of your trip on the MobiVision website shortly after you've finished driving.
This was created by using resources from AWS, Azure Maps REST API, Django Framework, as well as many python scripts to process the collected data.
MobiVision tracks the following bad driving habits which we call flags:
- Accelerating too hard
- Decelerating (braking) too hard
- Taking corners too hard
- Speeding 5mph above the speed limit
- Not stopping at stop signs
In order to detect all of these flags throughout your trip, MobiVision has 4 stages.
Stage 1:
Involves the physical device and capturing of all the raw data through a csv sheet. Data is collected in real time and recorded to be sent to our AWS infrastructure for further processing. Stage 1 is responsible for recording the following flags,
- Accelerating too hard
- Decelerating (braking) too hard
- Taking corners too hard
Stage 2:
First stage in post processing of original data from stage 1 through AWS infrastructure. The goal of stage 2 is to use object detection to detect stop signs throughout your trip and whether you stopped at them or not.
Stage 3:
Next stage in processing the data after stage 2 adds stop sign flags. This stage is responsible for periodically checking if the driver was speeding (going 5mph over the speed limit). Once speeding has been checked for, all flags have been processed and data will be saved to database to be viewed on website.
Stage 4:
Final stage in MobiVision processing of original csv sheet from stage 1. This stage involves generating a map of the final csv produced from stage 3 to visualize the trip into one image. Also responsible for displaying the data recorded from the trip onto the MobiVision Website.
Now let's look deeper into how exactly each of these stages work.
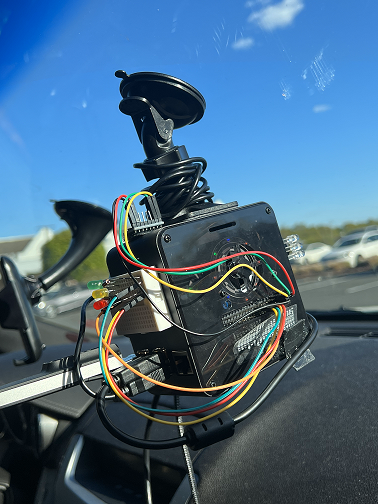
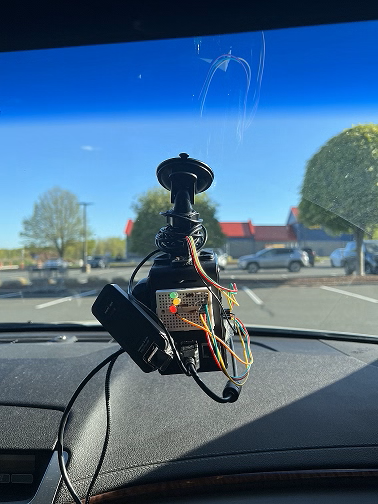
The physical portion of MobiVision uses multiple resources to collect and manipulate data in real time. Physical components include,
- Raspberry Pi 4b
- GPS Module
- ADXL345 Accelerometer
- Verizon MIFI USB Modem
- 640x480 Camera
Using these components, we can capture many pieces of information in real time to help to determine how safely you were driving.
The GPS module records NMEA (National Marine Electronics Association) data which can be parsed through for important information regarding your position including,
- Latitude
- Longitude
- Speed in knots (converted to mph)
MobiVision/Stage1/runMobiVision.py
Lines 69 to 76 in 0cc6c82
Now with these two components along with our camera, this is all the data that will be collected onto our raw data csv in real time. Our csv has the following format which makes it easy to parse through data for further processing,
Latitude, Longitude, Speed(mph), X-axis Acceleration(m/s^2), Y-axis Acceleration(m/s^2), Time(s), Flag
The script behind this loops every one second, and appends a new row with the current collected data into the csv. The way it is determined that you are accelerating too hard and breaking too hard is by comparing the drivers speed from one second prior the current speed. If your speed increase was over 6mph in a one seconds time span, a 'Hard Acceleration' flag will be added to the current row and the opposite will occur for hard breaking.
Because the area of the development of the MobiVision has highway speed limits of almost always 65mph, we have a 'Speeding' flag added at anytime your speed is above 70 because there are no speed limit signs around this speed that need to be checked later on (Stage 3). As for hard cornering, if your acceleration on the y axis averaged greater than 3 in one second, a 'Hard Cornering' flag will be added to the current row.
MobiVision/Stage1/runMobiVision.py
Lines 93 to 108 in 0cc6c82
Once the trip is finished, all the data from your trip will be saved into one csv with the three flags accounted for, and using the AWS library boto3, we can send this data into our cloud infrastructure to begin stage 2. This is possible because of the MIFI USB modem connected to the Raspberry Pi giving it internet service while driving on the road.
MobiVision/Stage1/start_instances.py
Lines 4 to 16 in 0cc6c82
We now see how the data is collected and recorded in real time. But this is an automated system, so how does the device know when your trip has started and ended without manual input? This is done by using the gps data to periodically check your speed before the data starts being recorded into a csv. If your speed is under 10mph, nothing will be recorded and the device will wait for you to drive above 10mph to start the main function.
MobiVision/Stage1/runMobiVision.py
Lines 161 to 174 in 0cc6c82
The way it is determined that you've stopped driving is by seeing how long your speed was below 8mph, if you've been traveling under 8mph for 60 seconds, the loop will be broken out of and the data will send the data to our cloud infrastructure. In order to know which state the device is, whether it be waiting for movement above 10mph or running main loop and so on. A state machine is used to change the LED's on the attached breadboard to indicate where in the code its currently running. See state_machine.py for more information Stage1/state_machine.py.
Stage 2 is the first processing of the initial data to determine if you've stopped at stop signs or not. This is done by using the video of the trip recorded by stage1 and using object detection to determine when stop signs appear in your trip and if you stopped at those stop signs or not. The AWS resources used to make this possible include,
- 1 g4dn.xlarge EC2 instance (great for accelerated computing / object detection)
- 1 sqs queue
- 1 s3 bucket
As shown in stage 1, before sending the data to the cloud we turn on our ec2 instances which are set to run our scripts on bootup. For the stage 2 EC2, once booted up the ec2 will be polling for messages to appear from the dedicated sqs queue. The stage 2 s3 bucket has an object creation event notification set to send a message to the sqs queue that the EC2 is polling from when a csv is put into the bucket (the video file is uploaded first then the csv to make sure both files are available when needed). Once the message appears, the script will parse through the json to get the files it needs to perform object detection on and download said files.
Lines 27 to 39 in 0cc6c82
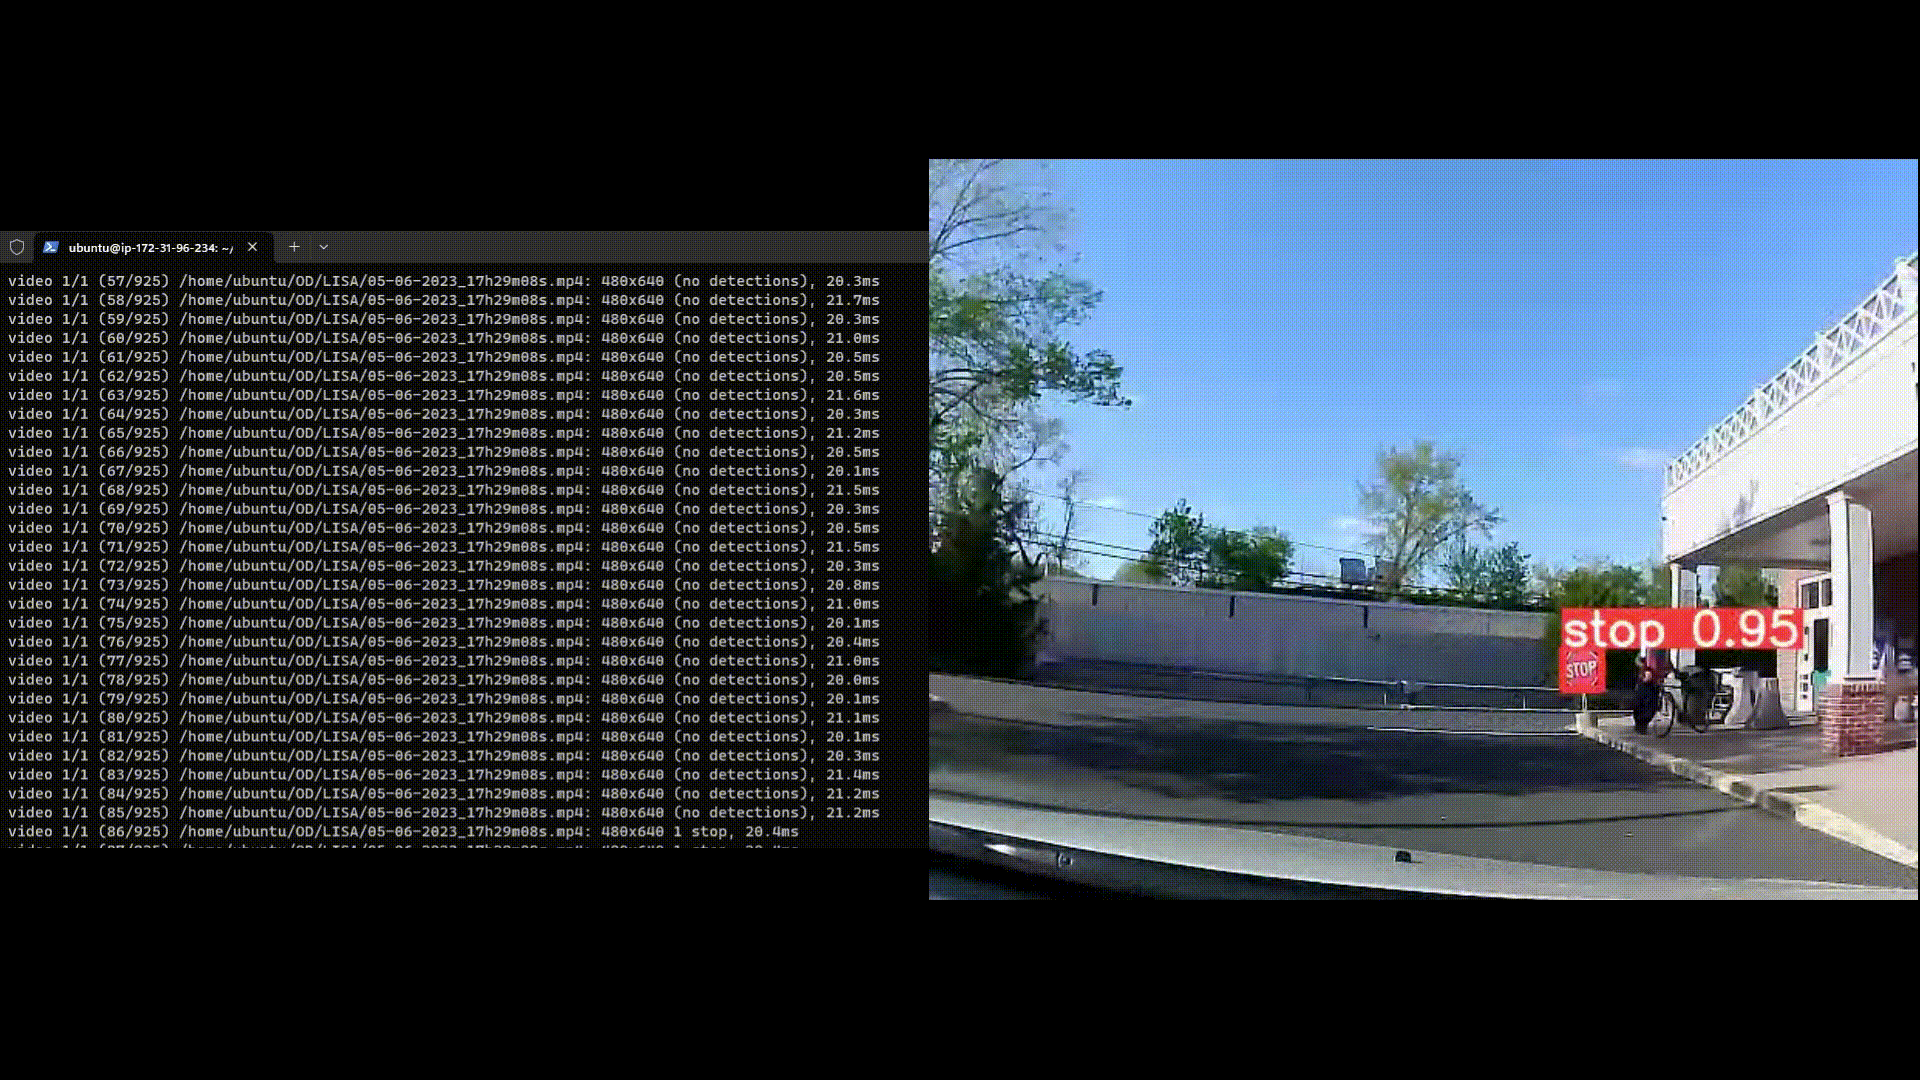
Once we have the files downloaded caused the event, we can begin detecting stop signs in the video recorded from the trip. The source of our object detection comes from ultalytics yolov5 github repo at https://github.com/ultralytics/yolov5. Coding a script/algorithm that can classify specific objects in videos was outside the scope of this project so we opted to use this is as a source of object detection. Along with this, we have 1200 images of stop signs with their respective labels provided by the LISA road sign dataset which was used to train the model to detect stop signs. We have the script running with a couple extra arguments including,
- 95% confidence threshold, doing this would filter out the false positives picked up from glare or signs that looked similar to a stop sign
- 10x video stride speed, this would make the process significantly faster by speeding the video up 10 times faster then the normal rate and the results were relatively the same
While the script is running it displays information we need to determine when stops signs appeared to the console, we can redirect the output of this script to a text file and re read it after its finished classifying the entire video.
Line 45 in 0cc6c82
Once the script is done and the entire video has been analyzed into the text file, we can use information from the text file to compare its results to the csv generated from stage 1 and add flags accordingly. Now by using this text file, we have 2 important pieces of information. On the right side we have what was detected, and on the left we have when it was detected.
To determine the when, we simply divide the current frame by the frame rate of the camera that recorded the video to get the time in seconds. The object detection script runs at 10x the speed and camera frame rate = 30fps, so we divide 30/10 = 3 and this value is what we divide the current frame by to get the time in seconds. But when exactly do we decide when to look at the time the stop sign was detected? If we say anytime a stop sign appears in the text, there would be many true posistives in an area in which only one stop sign was actually present.
So to make sure that we know a single stop sign was present comes with the following logic.
Lines 54 to 76 in 0cc6c82
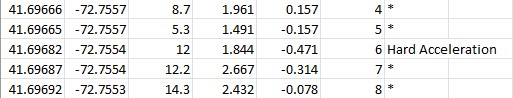
If your speed ever reached under 1.5mph between the previous 2 seconds and future 6 seconds the true positive occurred, then this is deemed as stopping and no flags will be added to the current row. Otherwise if your minimum speed was above 1.5mph for that time span, a 'Ran Stop Sign' flag will be added.
Lines 84 to 103 in 0cc6c82
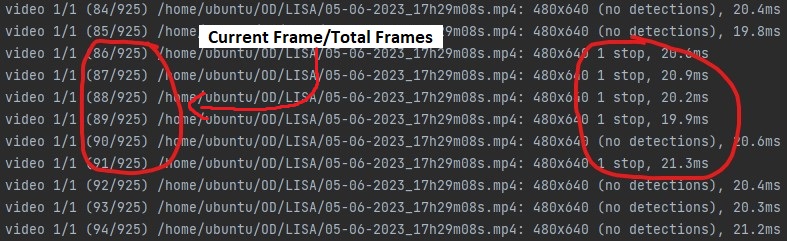
In the example/gif above, a true positive would have been determined at frame 89.
89/3 = just about 30 seconds
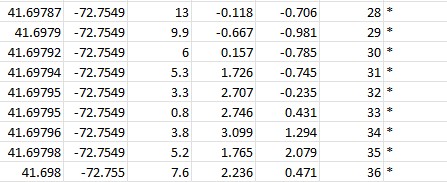
Looking at the csv after stage 2 has been processed, the vehicle completely stops at 33 seconds matching the criteria to have stopped at a stopped sign (any speed under 1.5mph between last 2 and future 6 seconds stop sign is found) and no flags were added.
But later on during the same trip when another true positive was detected
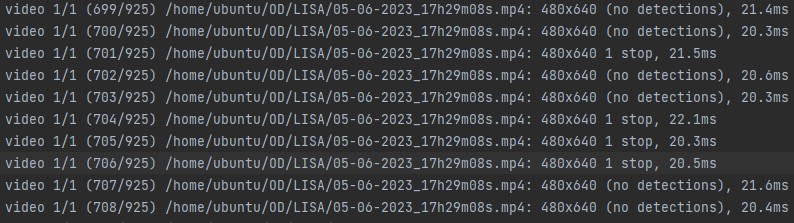
We see 4 stop sign frames occur before 4 no detections at frame 706.
706/3 = about 235 seconds
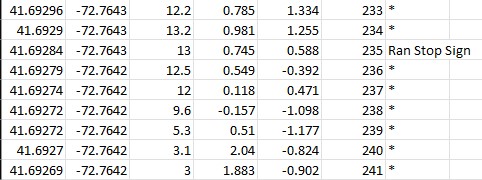
Looking at the csv post stage 2, because no speeds were below 1.5mph between -2 and +6 seconds a 'Ran Stop Sign' flag was added the row.
Once text file has been fully iterated through and all stop signs have been accounted for, the stage 2 csv is complete. We can now send this csv over to the stage 3 bucket to check for speeding occurences.
After the stop sign flags have been added, it's time to get speeding flags for speeds under 65 mph. And once we those flags added our csv will be finalized with all 5 flags fully processed and we can import important data from the csv sheet into our rds PostgreSQL database.Stage 3 is achieved with the following resources:
- 1 Lambda function
- 1 API Gateway REST API
- 1 S3 bucket
- 1 RDS PostgreSQL Database
- Azure Maps Rest API (More information at https://learn.microsoft.com/en-us/rest/api/maps/search/get-search-address-reverse?tabs=HTTP)
Firstly, csv is dropped into the stage3 bucket which will trigger the lambda function. With this we can extract information about the event that triggered the lambda and download the csv we need.
MobiVision/Stage3/stage3lambda.py
Lines 29 to 33 in 0cc6c82
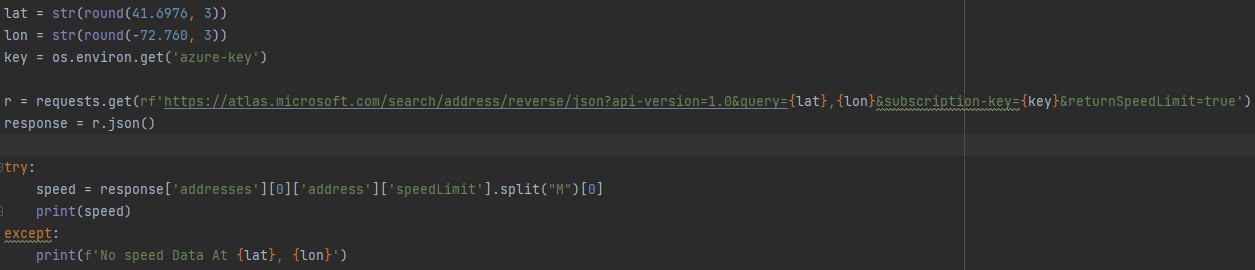
Once the csv is downloaded, we will iterate though the csv rows to check if you were over 5mph above the speed limit for speeds under 65mph. We check under 65mph because in stage 1 we already have speeding flags checked for those higher speeds. The way we check the speed limit is by using Azure Maps REST API and using the current rows latitude and longitude, we can get the speed limit of the exact position you were driving in. For the purpose of being efficient with the API calls instead of calling the api every row, we call it once every 10 rows (10 seconds). Your geographical position has changed enough in 10 seconds to warrant another api call as opposed to every single second.
Below is the logic behind using this API to get speeds limits and compare your current speed in the csv to the speed limit. If you were driving 5mph over the speed limit, a 'Speeding' flag will be added to the current row.
MobiVision/Stage3/stage3lambda.py
Lines 41 to 56 in 0cc6c82
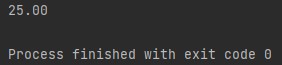
And below is the function with the API call that returns the speed limit
MobiVision/Stage3/stage3lambda.py
Lines 9 to 21 in 0cc6c82
Lambda script checked rows periodically for speeds limits, seen speed was 5mph above speed limit and added flags accordingly
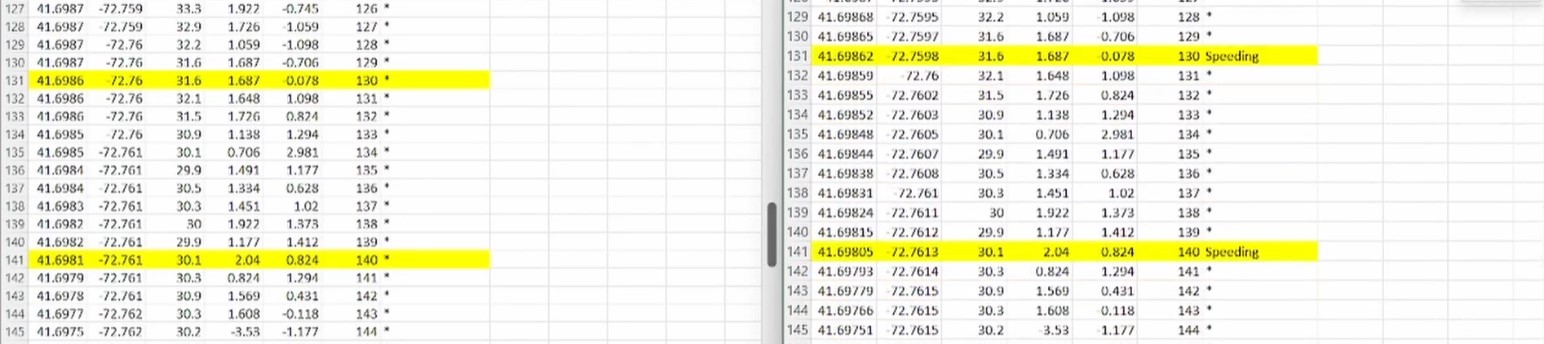
Using coordinates from above example to data returned by API
Once the csv has been iterated through completely, all 5 flags from stage 1 to now have been checked for and added to the current csv. But now what? How do we display this information in a easy to comprehend way without looking through say hundreds or rows in a csv to find out. What we do is put this on a website for the driver to easily see where flags were present in their trip. The way we do this is by using Django as our web server's front-end/back-end framework to retrieve and display all the information from the current trip and trips to come. In order to do this, Django needs access to this information constantly. A PostgreSQL database is set up with the following tables.
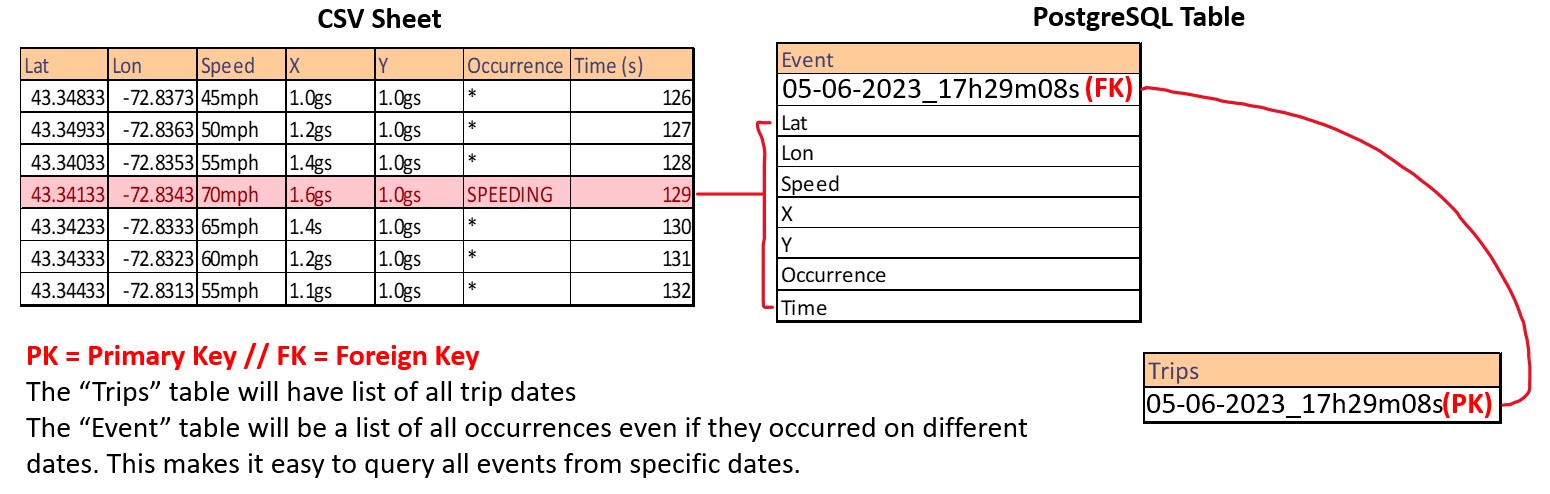
As you see in the image above, a row with a flag in it is the row we will append to our database. The primary key and foreign key elements will be the trip date and time of the trip being analyzed. In stage 1 we have a "date" variable to serve as a uuid for the current trip. This uuid contains the "Month-Day-Year_Hour_Minute_Second.csv" of the trip and is used throughout the entire process to make all trips unique.
Stage 1 date variable
MobiVision/Stage1/runMobiVision.py
Lines 33 to 37 in 0cc6c82
So how do we get this information into our database tables? Well during stage 3's lambda function it makes use of an API we created on API Gateway to add all rows with flags in them into our database.
Function that is called after speeding flags have been added
MobiVision/Stage3/stage3lambda.py
Lines 23 to 27 in 0cc6c82
The API is a POST REST API that uses lambda integration to handle connecting to our database and inserting information into our tables with a simple link. The lambda will query through the http string parameters and execute the psycopg2 commands needed to insert data into the tables.
First we set variables equivalent to the correct string parameters, and check to see if the uuid (tripdate) already exist in the "Trips" table
Lines 5 to 26 in 0cc6c82
If this is the first time the API is being called for the current trip, a new entry will be inserted into the "Trips" table first because the "Events" table requires a Foreign Key reference to the trips table to be valid. If this is not the first time the API is being called, then it will simply insert the current data into the "Events" table which holds all the events from every trip.
Lines 29 to 33 in 0cc6c82
Once all rows with flags have been inserted into the database, everything we need to display you trips data ready to viewed by using Django. The final csv is now sent to our stage 4 bucket.
For information on how to use PostgreSQL’s python library psycopg2 inside a lambda function, please check this repo https://github.com/jkehler/awslambda-psycopg2
Once we have our finalized csv with all flags appended and inserted into our database, it's time to visualize this data and display it on a website.This is done by using the following resources:
- 2 EC2 instances
- 1 S3 bucket
- 1 sqs queue
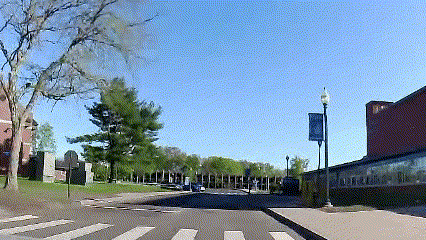
You may have noticed when introducing the MobiVision the maps that are shown on the website which visualize the entire trip into a single image. The way these images are processed are by using Selenium to grab a cross section of a map from OpenStreeMaps.org and some python scripting to fill in said image.
Firstly we start similar to stage 2 in that we have an event notification triggered by a csv upload to our stage 4 bucket send a message to an sqs queue. An ec2 dedicated to producing a map is polling for this message and once it is received will parse through the json for information regarding the file that caused this notification. Once downloaded, the logic for generating a map goes as follows.
Using the CSV's maximum and minimum latitude and longitude, we can generate a bounding box to use for a cross section of a map that all of the points of the csv will fit inside. Meaning the entire trip of all coordinates logged can be viewed in this single image.
MobiVision/Stage 4/MapVisualizer/test.py
Lines 8 to 18 in 0cc6c82
They way we get this map is by using selenium to access OpenStreetMaps.org and modifying some of the elements of the html to grab an exact cross section of a map we need based on the coordiates.
MobiVision/Stage 4/MapVisualizer/test.py
Lines 32 to 49 in 0cc6c82
Base map generated from selenium script:
Other methods of retrieving a cross section of a map based on coordinates failed. Libraries that do just this aren't precise enough with the coordinates to be used for our purposes or too costly.
Now that we have this base map, the way we introduce our data into it comes from this formula for converting one min/max set to another min/max set.
MobiVision/Stage 4/MapVisualizer/drawmap.py
Lines 15 to 18 in 0cc6c82
The formula used in this function will take the input latitude and longitude and convert it into the length and width in pixels of where it should be on the image. So when we iterate through the csv of the current trip, we need to use this function to return all the points from the csv to be converted into image points. If there is a flag present we will append it to flag points with a unique flag color.
MobiVision/Stage 4/MapVisualizer/drawmap.py
Lines 77 to 96 in 0cc6c82
Now that we have all of the coordinates converted to image points, we just use the PIL library to draw these points onto the base image. For image points we draw a line, for flag points we draw a circle with the corresponding color.
MobiVision/Stage 4/MapVisualizer/drawmap.py
Lines 101 to 112 in 0cc6c82
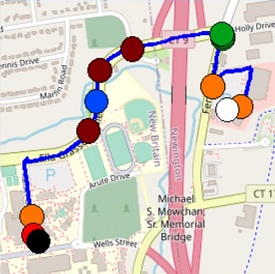
The start and end points (White and Black) follow the same logic as the flag circles
Once we have this final map, to display it on our website our webserver is listening (same logic as stage 2 and stage 4) for a sqs message from a png upload to the stage 4 bucket. Once received the webserver will automatically save it to it's static files to be viewed on the website. https://github.com/bdubxl/MobiVision/blob/main/Stage%204/Website/autostatic.py
After configuring or settings.py file for connectivity with our database, using Django's "inspect.db" tool we make migrate the exact arrangement of the tables into our models.py file.
MobiVision/Stage 4/Website/models.py
Lines 3 to 29 in 0cc6c82
Now once we have made the models migrated using our views.py file we can query the data using django functions and display the queried data into HTML files for viewing.
MobiVision/Stage 4/Website/views.py
Lines 5 to 15 in 0cc6c82
Note this is a very basic website with the purpose of just showing data from your trip and nothing more.
HTML utalizing contextual views variables ("Trips Page")
MobiVision/Stage 4/Website/index.html
Lines 17 to 24 in 0cc6c82

"Events (More Details) Page"
MobiVision/Stage 4/Website/events.html
Lines 22 to 52 in 0cc6c82
