In this project, you will investigate a classic phenomenon from experimental psychology called the Stroop Effect. You will learn a little bit about the experiment, create a hypothesis regarding the outcome of the task, then go through the task yourself. You will then look at some data collected from others who have performed the same task and will compute some statistics describing the results. Finally, you will interpret your results in terms of your hypotheses.
If you need a refresher on statistics, you can take Udacity's free Statistics course.
Statistics is a major component of data analysis, it allows you to investigate data and make inferences based on your observations. A foundation in statistics also allows you to be a consumer of analyses that others perform, and allows you to relate to the conclusions others have drawn from their investigations.
This project will review the basic concepts of statistics, including:
- How to identify components of an experiment
- How to use descriptive statistics to describe qualities of a sample
- How to set up a hypothesis test, make inferences from a sample, and draw conclusions based on the results
Using statistics to draw valid conclusions about data is an important part of a Data Analyst's work. A strong grasp of statistics will also be necessary in the rest of the Nanodegree program.
Follow these instructions and create a pdf or html document answering the questions. These document formats are compatible across a broad range of computers and browsers and are one of the surest ways of making sure that your intents are received properly. If you are using a word processing program such as Microsoft Word or LibreOffice, make sure that you save your document as a pdf and include the pdf in your project submission.
There is no need for specific software for this project, but we encourage you to use Jupyter Notebook workspace in the next section to complete the project using Python.
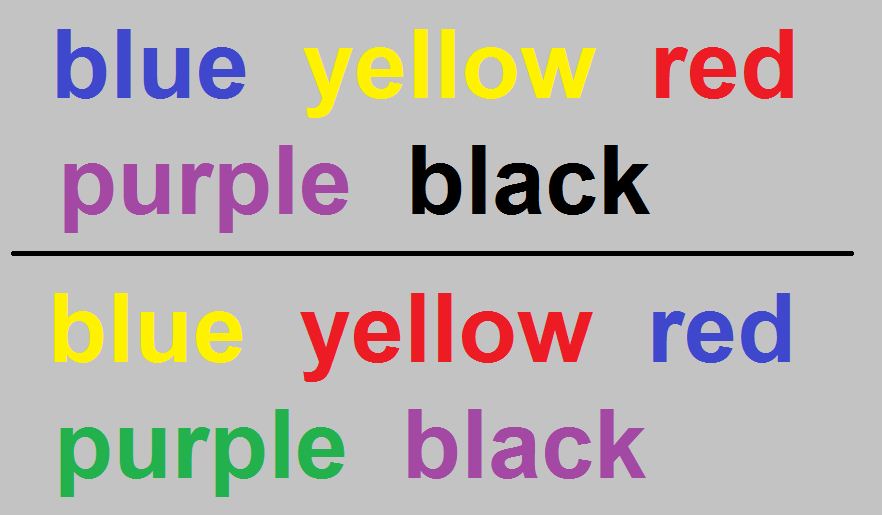
In a Stroop task, participants are presented with a list of words, with each word displayed in a color of ink. The participant’s task is to say out loud the color of the ink in which the word is printed. The task has two conditions: a congruent words condition, and an incongruent words condition. In the congruent words condition, the words being displayed are color words whose names match the colors in which they are printed: for example RED, BLUE. In the incongruent words condition, the words displayed are color words whose names do not match the colors in which they are printed: for example PURPLE, ORANGE. In each case, we measure the time it takes to name the ink colors in equally-sized lists. Each participant will go through and record a time from each condition.
As a general note, be sure to keep a record of any resources that you use or refer to in the creation of your project. You will need to report your sources as part of the project submission.
- What is our independent variable? What is our dependent variable?
- What is an appropriate set of hypotheses for this task? What kind of statistical test do you expect to perform? Justify your choices.
Now it’s your chance to try out the Stroop task for yourself. Go to this link, which has a Java-based applet for performing the Stroop task. Record the times that you received on the task (you do not need to submit your times to the site.) Now, download this dataset which contains results from a number of participants in the task. Each row of the dataset contains the performance for one participant, with the first number their results on the congruent task and the second number their performance on the incongruent task.
- Report some descriptive statistics regarding this dataset. Include at least one measure of central tendency and at least one measure of variability.
- Provide one or two visualizations that show the distribution of the sample data. Write one or two sentences noting what you observe about the plot or plots.
- Now, perform the statistical test and report your results. What is your confidence level and your critical statistic value? Do you reject the null hypothesis or fail to reject it? Come to a conclusion in terms of the experiment task. Did the results match up with your expectations?
- Optional: What do you think is responsible for the effects observed? Can you think of an alternative or similar task that would result in a similar effect? Some research about the problem will be helpful for thinking about these two questions!
Use descriptive statistics and a statistical test to analyze the Stroop effect, a classic result of experimental psychology. Give your readers a good intuition for the data and use statistical inference to draw a conclusion based on the results. Use the Statistics Placement Advisor to determine if reviewing any of the Statistics course will help you prepare for this project.
Once you have a document answering the questions on the previous page, be sure to check through the project rubric before you submit your report. Your project will be evaluated as “meets specifications” only if it meets specifications in all the criteria. If you see any category where you do not meet specifications, make sure you revise your report to meet the rubric criteria.
Ready to submit your project? Collect the following files:
- Answers to the questions on the previous page in a pdf or html document.
- A list of websites, books, forums, github repositories, and other resources (web or otherwise) that you referred to or used in this submission. This can be attached to the bottom of your answers document or placed in a separate plaintext file.
- (Optional) Any code or other documents that you used to compute statistics for completing the project tasks.
With these materials, go to your Udacity Home page, click on this project, and follow the instructions to submit:
- If you want to submit your files through a "Link to Project", upload your project files onto Github and send us the link.
- If you instead want to submit your files through "Upload a Zip", compress your project directory, and submit that zip file.
It can take us up to a week to grade the project so keep checking back for updates.
If you are having any problems submitting your project or wish to check on the status of your submission, please email us at dataanalyst-project@udacity.com.