Home
Students often find it challenging to grasp difficult concepts of graph algorithms during their time in academia. Research has shown that visual learning using animation may be beneficial for students when used as a learning aid.
This project aims to build a tool that can be used as an aid when teaching shortest path graph algorithms such as Dijkstra, Bellman-Ford and Floyd-Warshall. The tool also supports quiz generation for the Dijkstra algorithm including automated marking. Based on the literature review, the best technologies to use for the system are Python3, Django, JavaScript, vis.js and MongoDB.
After developing the tool, users were surveyed to evaluate if the
application had helped in any way. From the results,
83 of users
said they had improved their understanding of the Dijkstra algorithm. In
addition to this, 90
of the users found that the animations were only ‘somewhat’
helpful when learning about the algorithm; suggesting that animations
may not have a significant impact when used as support for learning.
Analysis of the tool and feedback from users suggests this project is successful in achieving the original goal.
I want to thank my supervisor Professor Maciej Koutny, for the advice and support provided during this project. I would also like to thank Laheem Khan and Szymon Jackiewicz for their support.
I declare
that this dissertation represents my own work except where otherwise
stated.
This chapter will talk about the motivation behind this project and introduce the overall aims and objectives for this project. In addition, a Gant chart will also be included at the end of the section that demonstrates the timeline for this dissertation.
Understanding and knowing the process of how algorithms works are a
vital part of Computer Science. Some of the algorithms covered in
Computer Science can be hard to grasp or visualise; especially true for
graph algorithms. To help with this, the use of visual aids may be
beneficial. Static images may also help, but the use of animation may be
more powerful. The use of animation in teaching algorithms to students
showed a positive tendency as suggested by Byrne
The
experiment shows a trend towards a benefit of animations and predictions
on students’ ability to solve procedural problems about
algorithms
(Byrne et
al., 1999).
Currently, no tool is readily available to students that can aid in the learning of algorithms. The resources are fragmented as they are spread across different sites and web pages. There is no central system where a student can go to learn more about algorithms and test their understanding. This project aims to solve these issues by creating a tool that can be used as an aid to better the understanding of the algorithms, as well as creating a platform to test the user’s knowledge of algorithms. This paper will explore ways to visualise algorithms and to test the users understanding of algorithms.
Aim: Develop an application that will enable students to enhance their understanding of algorithms via visualisation and questions.
Objectives:
-
Perform an investigation into graph algorithms to identify which subset of algorithms should be included in the application.
-
Analyse and create a design solution that appeals to the end user, while ensuring usability is still high.
-
Animate the chosen algorithms
-
Create a subsystem to allow automatic marking after completing tutorials contained on the site
-
Evaluate the app using the user’s testing scores and questionnaires as a focal point of analysis to conclude if the app has allowed the user to gain a deeper understanding of the algorithms.
The figure below shows the project plan.
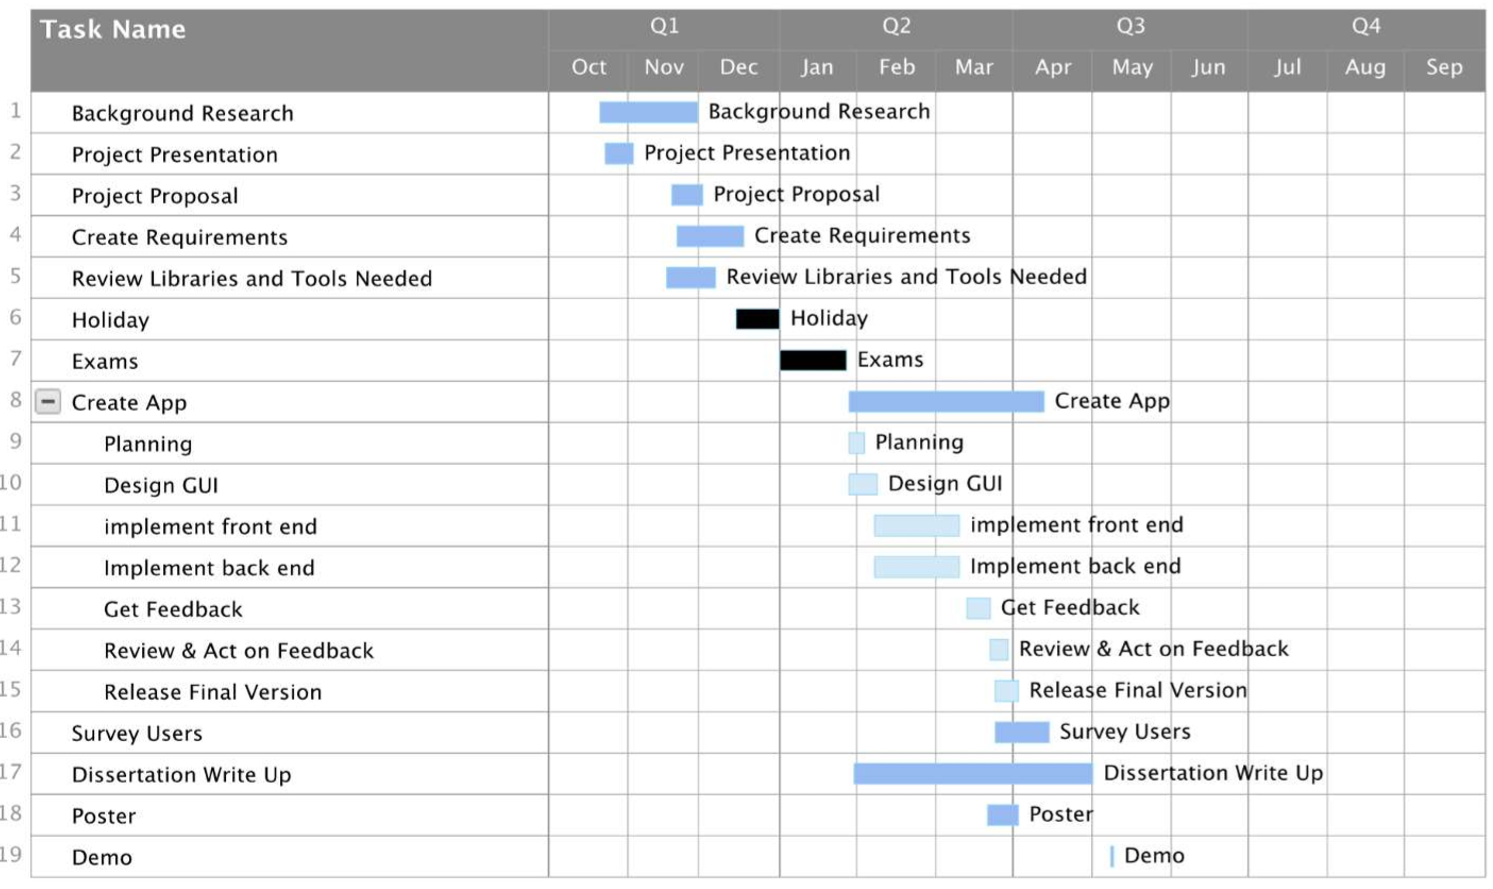
[fig:_Project_Schedule]
This section aims to introduce some of the essential concepts behind the graph structure and some fundamental problems where graph structure is used to solve the problem. We will also briefly look at how animating a graph can be achieved, as well as investigate which technologies can be used to realise the aims and objectives for this project.
Also, this chapter will also cover some of the principles and features that are required to create a great user experience, by looking at human-computer interactions.
In Computer Science the graph structure is used extensively throughout; it is fundamental in representing the flow of computation. By representing a problem as a graph structure, we can apply graph theory to try and solve these problems. Today, it is commonly used in applications such as Google Maps and Facebook (Ganguly, 2018).
Bondy et al defines a graph G as an
ordered
triple
consisting of a nonempty set
of vertices, a set
disjoint from
, of edges, and an incidence function
that associates with each edge of
G
(Bondy
Murty, 1976).
This definition describes a non-weighted graph, for a weighted graph let
there be a function
which returns the weight (distance) of the edge
, then, we can
define graph
with
as a weighted graph. The weights can be either
negative or positive for a weighted graph. However, with negative
weights, it is possible to have a negative weight cycle. A negative
weight cycle appears when the total sum of a cycle is negative; in such
case, we say the shortest path is not well defined.
Throughout this project, a graph will be represented as where
are
the set of vertices and edge (respectively) in the graph. An edge
will also contain
which
represents the start and end vertex (respectively).
One of the most common problems that Computer Science students encounter is the shortest path problem. The shortest path problem can be applied to a weighted graph structure to find the most efficient path in a given graph structure. There are many variants of this problem, but for this project, we will be looking at two main variants: single-source shortest-paths and all-pairs shortest paths problem.
Cormen et al define the Single source shortest path problem as
finding the
shortest path from a given source vertex
to each vertex
(Cormen, 2009). The single-source shortest path problem is to find the
most optimal path from a source vertex to all other vertices on the
graph. Dijkstra and Bellman-Ford algorithms are commonly used to solve
this problem.
Dijkstra algorithm is a greedy shortest path solution which has a
worst-case performance of
, where
and
are the set of edges
and vertices, respectively. Dijkstra’s algorithm can build up a table of
the shortest path from each node, given a source node. The algorithm can
also build a table of optimal previous vertices. By using the distance
and previous vertices table we can use it to figure out what the
shortest path will be from any given node to another. The algorithm is
commonly used for network routing.
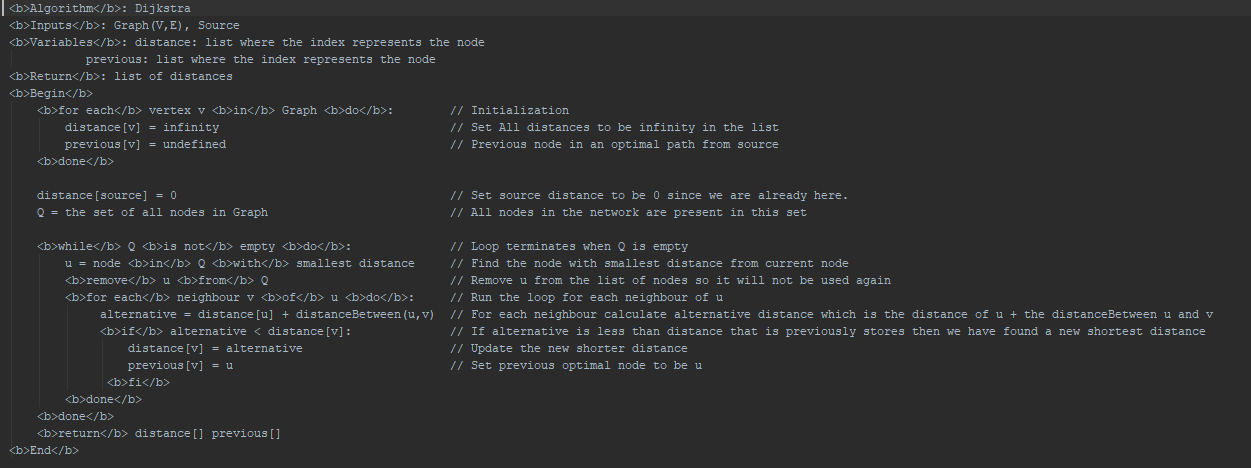
For Dijkstra’s algorithm, we will assume the graph
will be a directed
graph with no negative distances. The pseudo code of the algorithm can
be seen in Appendix A1.
The Bellman-Ford algorithm is comparable to Dijkstra’s algorithm; the
only difference being the Bellman-Fords algorithm does not end after
visiting each node once. It has a worst-case performance of where
and
are the number of vertices and edges present in the
graph, respectively. The main advantage of using the Bellman-Ford
algorithm over Dijkstra’s algorithm is that the Bellman-Fords algorithm
can handle negative distances as all edges are considered in every
iteration unlike Dijkstra, where each node is only looked at once. In
addition to this, Bellman-Fords algorithm can be used to detect a
negative weight cycle in a graph.
For Bellman-Fords algorithm, we will assume the graph
is a directed graph
that can contain negative distances. Pseudo code shown in appendix A2.
Cormen et al defines the All-Pairs shortest path problem as
To find, for
every pair of vertices
, a shortest (least-weight) path from
to
(Cormen, 2009). The
all pair shortest problem to find the optimal distance between all
vertices in a given weighted graph. One way to solve this problem is to
run a single source shortest path algorithm on all vertices of the
graph. The output of the action will produce a tabulated result of all
possible shortest paths for all vertices in the graph. Another way to
solve the problem is to use the Floyd-Warshall algorithm.
The Floyd-Warshall algorithm uses dynamic programming to solve the all
pairs shortest path problem. It has a worst-case performance of . This performance is quite
remarkable considering there may be up to
edges in the graph, and every combination of
edges is tested. The algorithm can be used for both positive and
negative weights. The pseudo code shown in Appendix A3.
The animation is the process of changing the appearance or creating the optical illusion of movement of an object over time. The use of animation techniques can be powerful when used as a teaching aid; it assists in the visualisation of the problem.
The use of dynamic program visualisation may be an effective way to
animate a graph algorithm. Diehl describes the dynamic program
visualisation as identifying interesting events is a widely used manual
instrumentation technique. The actual data is gathered at run
time
(Diehl, 2005).
This technique gathers the data at run time to highlight key events of
the algorithm. Applying this technique can be useful for this project as
it will show the user visually the critical elements of the algorithm.
State driven animation is the technique used to map between a program
and a visualisation state (Kerren
Stasko, 2002).
When an algorithm is executed, it leads to different states that can be
mapped to a visual representation of the state; often this can be built
up using primitive objects like circles, squares and lines. Therefore,
animation can be achieved for a graph network by stepping through these
states and displaying the appropriate visual representation.
Choosing the right technology stack to develop the tool is a critical part of the development cycle. Choosing the wrong stack and technologies may make the project much more challenging to develop than necessary. For this reason, we will be looking at some of the most popular technologies, languages and stack to develop on.
Python is a high-level interpreted language with weak typing, first released in 1992, created by Guido Van Rossum. It supports many programming paradigms including object-oriented and procedural. In comparison to other modern languages, such as C++, Python performs worse in terms of performance.
In contrast, due to the nature of dynamic types, Python lets developers reduce boilerplate code, therefore, speeding up the development process. Furthermore, Python has an extensive amount of third party and built-in libraries to aid in the development of this project. In addition to this, the author has a level of experience in using Python.
Django is a full-stack web framework written in Python. It follows the
Model View Controller (MVC) pattern as the core architecture of the
framework (Holovaty Kaplan-Moss, 2009). Using the MVC pattern allows the developer to
keep all the components loosely coupled therefore letting each component
to be changed without affecting the other. This is hugely beneficial for
this project as it lets the developer develop specific components
without concerning about the specifics code of other components.
Moreover, Django provides the ability to run the application without needing the dependency of a server or any other technologies while developing locally, unlike the LAMP stack. This makes development straightforward as it requires no other prerequisites. Django only needs a python interpreter to start developing and will not need any other configuration to start development.
Django uses a templating engine to render pages for the user. This permits the developer to follow the DRY (Don’t Repeat Yourself) principle. The use of templates can make the application more consistent to the end user as templating allows inheritance. Inheritance will allow the developer to keep the layout of all pages consistent. This should improve the overall user experience since it follows the HCI principle.
Flask is a lightweight microframework for Python; it provides a solid core with essential services, while extensions provide the rest (Grinberg, 2014). Flask requires more involved work as simple features like connecting to a database requires the developer to either implement it or use third-party libraries. This can be great for projects that need a specific implementation of standard features.
Like Django, Flask uses a templating library called Jinja. It is very similar to the Django templating language and has the same features but provides more Python-like expressions.
For this project the level of control Flask provides is not needed. By using Flask, there might also be an increased risk of more extended development as time can be wasted trying to find and integrate libraries to implement common features.
JavaScript (JS) is a high-level, interpreted and weakly typed programming language with object-oriented capabilities (Flanagan, 2006). It is one of the core technologies for the world wide web along with HTML and CSS. JS is mainly used on the client side for webpages as it allows for interaction with the user. JS supports many programming paradigms enabling it to support event-driven style programming, making it essential for user interaction.
However, due to weak typing, JavaScript is much harder to debug when compared to other languages with stronger types. The nature of JS means it uses a lot of type conversion without the developer knowing, making it much more error-prone.
Yet, in order to provide event-driven capabilities for the client, JavaScript must be used as it is the only language available for web browsers.
Vis is a JavaScript library that provides dynamic browser-based visualisation of graph networks. It can visualise a graph network and provides an application programming interface (API) to manipulate the graph using JS. In addition, Vis provides a well-documented API with simple data structures. The data structure used in Vis can be used as a starting point to represent the graphs on the server, enabling to read and parse data on the server a more straightforward task.
Cytoscape is a powerful JavaScript library that allows developers to visualise and analyse graph networks. It is much more capable than vis.js but brings in much overhead as it is designed for complex graph structures. This project only requires the visualisation of a small graph network and the ability to manipulate the said graph. Cytoscape can provide for these requirements and brings many features, but this adds unnecessary complexity to the project.
The database is an integral part of an application to provide dynamic content and create a better user experience. The database will need to store necessary user information and other information that the tool may require. There are two major types of databases currently used in the industry; Relational Database and NoSQL databases.
MongoDB is a NoSQL database and uses JSON-like (JavaScript Object Notation) document structure to store the data internally. It is usually packaged up with modern technologies such as the MEAN stack. Mongo has a relatively small learning curve as it does not require the understating of the ACID principles or database relationships. Furthermore, Mongo allows dynamic schemas meaning the documents in a single collection can have a different structure (Chodorow, 2013). This can be great for fast development or prototyping an application as the developer will not need to recreate the table every time they wanted to change the structure.
On the contrary, a flexible schema will be harder to maintain; a new structure could make the existing data invalid and cause discrepancies in the application leading to more errors. Also, MongoDB is much simpler to set up as it is easily set up in the cloud by third-party providers. MySQL and Postgres also have cloud solutions, but most cost money and does not offer free solutions. The cloud solutions also offer real-time metrics of the site to monitor data and an easy way to manage the data across the database. This further simplifies development as the developer will not need to spend time configuring database servers as cloud solutions will already be set up and ready to use.
MySQL databases are dominant databases that use relations to link tables and use a structured query language (SQL) to query the data. This sanctions the developer to write custom queries to retrieve a specific set of data. MySQL seems to be the go-to option for many applications that requires a database. It provides consistent performance and has a large community behind it. Additionally, MySQL is ACID compliant, making it ideal for uses that require a guarantee of a database transaction, such as real-time systems.
This project does not need a guarantee for database transactions; the application should not have any use cases where assurance is needed for any action. If the database transaction was to fail, the user should be able to redo their action and not cause many problems for the application. Moreover, the application will not have any complex database structure and will not need the use of a powerful query language.
The MEAN
stack is a powerful, full-stack JavaScript solution that comprises of
four major building blocks: MongoDB as the database, Express as the web
server framework, AngularJS as the web client framework, and Node.js as
the server platform
(Haviv, 2014). The MEAN stack is currently the most popular stack to use
for newly developed applications since developers only need to master
one language, JavaScript, to maintain both front-end and backend. By
using a framework that only requires the knowledge of a single language
it is easier to maintain the project over time.
However, the author’s knowledge in JavaScript is fundamental; therefore, developing the entire application in JavaScript may increase development time for this project due to the learning curve. Furthermore, it was found while experimenting with setting up the MEAN stack, that it can be difficult and time-consuming to build a small project; since the stack needed many configurations to set up correctly. This could further slow down the deployment of the application as it would take too much time to configure all the settings correctly.
Being able to automate deployment and builds considerably speeds up development and testing as the developer will not need to spend time deploying after updating the code base. Tools offered by third-party providers greatly help with development regarding automating builds and deployment. An analysis will be performed on two industry leaders, Amazon Web Services and Heroku.
Heroku is a cloud platform that can help with automatic deployment. It supports many different languages like PHP, Node and Python. Heroku is very accessible for projects that are open source and do not have a big budget. It also has integration with GitHub; a Microsoft owned web-based hosting service for version control using git. This is beneficial since it allows the developer to integrate deployment services to the repository directly. Also, Heroku lets developers add plugins to the application using their marketplace. This allows developers to add custom plugins like analytics and monitoring services for free, providing key metrics that can be used to improve the application.
Using Heroku warrants the developers to create applications without having to worry about how the details of how the servers are set up (Pérez, 2013). Using a cloud-based system such as Heroku will give the developer some extra time that otherwise would have been spent configuring servers, doing builds and other development operations. Also, Heroku has broad community support with preconfigured starter templates available to download, further improving the initial development time. Adding to this Heroku’s support for third-party plugins and pricing are particularly appealing for this project.
Amazon Web Services (AWS) is Amazon’s solution for cloud-based computation. AWS provides many services to the developer ranging from media services to continues delivery. AWS uses a pay-as-you-go model that charges the developers based on the amount of CPU time the application uses on AWS services. Although Amazon provides services for continues delivery, it is not as easy to use when comparing it to Heroku. However, when comparing AWS to Heroku, AWS provides services that can be easily scaled on demand and will be able to handle heavy loads if needed. This project is not expected to handle heavy traffic during development.
The author’s knowledge of JS is minimal and will be a significant deciding factor when choosing the technology. Writing the whole application using one of the JS stacks will mean that the application will be more error-prone due to the author’s ability in the language. On the other hand, Python’s performance is slow when compared to JS (Gouy, 2019) but provides much faster development due to the small learning curve and an insignificant amount of boilerplate code. Besides, using Django over Flask will further improve development speed as most of the standard features will already be provided by Django. Taking into consideration all these factors, the best choice for this application is Django. It merely provides the fastest development time and combined with the author’s ability in Python to make this the right choice for this project.
Both Cytoscape.js and Vis.js provides comprehensive features to visualise graph networks. However, the author prefers the documentation provided by Vis.js due to its simplicity. The documentation provided examples with well-written explanation for each aspect of the library. On the other hand, Cytoscape can tolerate for complex manipulation and visualisation, whereas, Vis is a much more lightweight library; allowing it to be used to animate a graph using a more straightforward solution than Cytoscape. Cytoscape does offer more features than Vis but trades simplicity for those features. For that reason, using the more lightweight option such as Vis will keep the solution simple.
This project is not expected to require complex queries to retrieve; the data stored by the application should be simple with no complex structures. MongoDB offers a simple data retrieval process and speedy performance when compared to an SQL database. Mongo is also offered by a lot more cloud providers than MySQL, so it is much easier to find a provider that is within the scope of this project. The author believes MongoDB will be most suitable for this project due to the flexibility and time-saving in development Mongo provides.
AWS gives many services but can be expensive over time, while Heroku provides continues delivery and automation. Both are excellent choices for this project. Heroku provides a reliable service with GitHub integration and community support to help with development. The pricing available of Heroku as well as the third-party plugin options to monitor the application outweighs the services provided by AWS for this project; therefore Heroku seems to be the right choice for this project. Below is a list of feature comparison tables that were used to help decide which technologies to use.
Human computer interaction (HCI) is the discipline that is concerned with user performance in the context of any system, be it may computer, mechanical or manual (Dix, 2004). The study of HCI essential part of system design, it involves the implementation and evaluation of interactive systems in the context of the user’s task and work.
We will be looking at three fundamental principles that are followed when designing a system as described by Dix.
Dix describes learnability as
The ease with
which new users can begin effective interaction and achieve maximal
effectiveness.
(Dix,
2004).
Learnability allows new users to understand how to use the application quickly and then attain a maximum level of performance. Achieving learnability requires the features listed below to be present.
The system is predictable if the user can determine the effect of future interaction based on previous interactions with the system.
A system is synthesizable if the user can assess the effect of past operations on the current state of the application.
If the user can determine how to initiate any interaction, due to the knowledge they have acquired from other systems, then the current system must be familiar to the user.
The system is generalizable if the user can apply their knowledge of a specific interaction to other similar situations, that they have previously not encountered before.
A consistent system is one which the likeness in input-output behaviours arises from a similar situation.
Dix describes flexibility as
Flexibility
refers to the multiplicity of ways in which the end-user and the system
exchange information
(Dix, 2004).
The system lets the user freedom of the constraints imposed onto the user by the system on the input dialogue.
The system can support user interaction that may transpire more than one task at a time.
The user must be able to pass the control of the execution of a given task so that its either become internalised by the user or the system or, shared between them.
The system must allow the substitution of equivalent values of input-output arbitrarily.
The user interface must be modifiable by the user.
Robustness is described as
The
robustness of an interaction covers features that support the successful
achievement and assessment of the
goals.
(Dix, 2004).
The user must be able to evaluate the internal state of the system from its observable representation.
The user must be able to take corrective action on the system once an error has occurred.
The system informs the user on its current state at the rate of communication perceived by the user.
The system must support all the tasks the user wishes to perform on the system in the way the user understands them.
Developing a system without a design can cause significant hindrances in the project. This chapter will give a high-level overview of the system as well as describing the requirements of the project and designs for vital parts of the application.
The table below shows a summary of the requirements. A detailed description of the requirements can also be found in this section.
This requirement states that the user must be able to see a graph network that is used for the corresponding algorithm. The graph should not be in a text state, instead shown as a network of nodes and edges with clearly labelled distances on each edge, as well as showing the direction for the edge. In addition, the nodes should also be clearly labelled by their node number.
The user must be able to interact and manipulate the graph (where the graph is described in R01). By interaction we mean the user must be able to click, select and move, the edges and nodes around the canvas. Manipulation will be defined as the user’s ability to edit and delete both edges and nodes that are present in the graph.
The application must animate all three algorithms. The animation can be simple as highlighting the edges, nodes and the corresponding line in the pseudocode (where the pseudocode requirements are described in R07). The animation must be consistent among all three algorithms with clearly labelled keys shown for colours that have been used to animate the graph.
The tool must show the state of essential variables while animating the algorithm (where the animation is described in R03). The essential variables will be defined as follows:
-
In Dijkstra’s algorithm, the essential variables are set Q, distance, neighbours.
-
In Bellman-Fords algorithm, the critical variables are u, v, distance, distanceBetween(u,v).
-
In the Floyd-Warshall algorithm, the crucial variables are distance, i, j, k
More variables can be shown but the variables described here must be present.
The application must allow custom graph inputs for all three algorithms if the user so desires. The input for each algorithm will be the graph and a source node if needed. The source can be any one of the nodes in the graph.
The graph can be automatically generated at the start but must give the user a choice to manipulate the graph, thus a custom input for the algorithm.
The user must control the speed at which the animation occurs. The user must optionally be able to step forwards or backwards if they so choose. Also, the application must give the option to allow the animation to be played or paused at any stage.
The corresponding pseudocode must be shown to the user alongside the graph. This code should include the line numbers when displayed to the user. The code should be the same as described in the background section.
The application must have a tutorial interface. The interface should ask questions about the Dijkstra algorithm to test the users understanding of the Dijkstra’s algorithm. The tutorial should include questions about the state of the nodes and the distance variable for a random stage of the iteration of the algorithm. The questions generated must also have answers to them (see R09) as well as generating a random graph for the questions. This page should also be restricted to logged in users only.
The tutorial as described by R08 must also produce answers for each question. After the user submits the quiz, it must automatically be marked by the server. The correct answers should not be visible on the client machine but should be presented as a multiple choice to the user.
Once a user submits the attempted answers for a question it should be stored on a database along with a mark, maximum mark and the questions answered with the attempted answers. This should be linked by the user. See also R13
After the user submits the tutorial, the user should be presented with a summary page showing them where they went wrong along with their score. This page should also show their progress by plotting a graph of all the marks they achieved with respect to time in days as well as other statics that may be relevant. This page should also be restricted to logged in users only.
The user info should be tracked using a login system. The login system can be a third-party library such as Google authentication or a custom one. No matter which one is used, a user id must be generated that is stored on the database.
As well as storing questions and attempted answers (R10) the application must store the generated graph on the database. If the user is logged in, then the user must have the choice of using any graph they have previously encountered in tutorials, in the Dijkstra animation page.
The application must have the same features on both mobile and desktop applications and should easily be accessible from both platforms. Being on mobile should not restrict any features and vice versa.
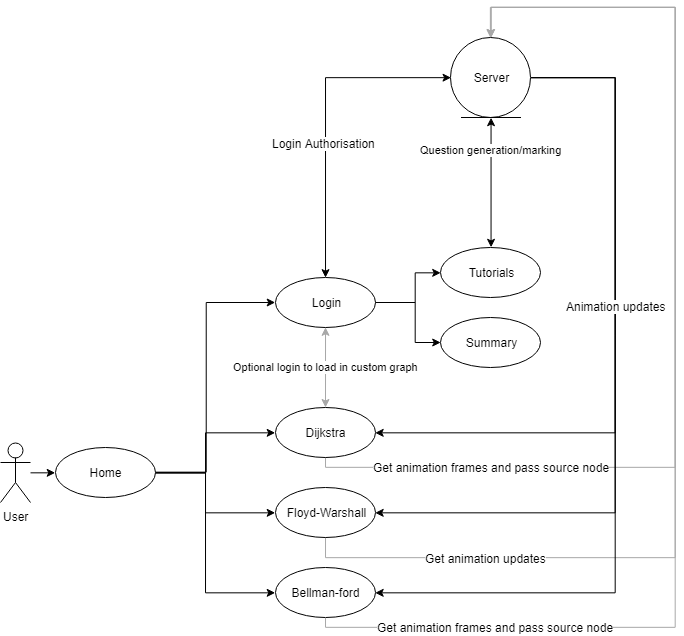
Figure 2 shows a high-level overview of the proposed system, the first
page the user encounter is the homepage, from where the user has the
option go to any of the following pages: Login, Dijkstra, Floyd-Warshall
Bellman-Ford.
The tutorial and summary page needs user authentication to be accessed
as they are specific to each user. The Dijkstra page will have an extra
option to load previous graphs they have encountered in completed
tutorials if the user is logged in.
In addition, all algorithms pages will use get the animation updates from the server which will be then used to animate the graph on the client. Any requests made to the server that does not need to render a page will be made through the API (as defined in section 3.4). In figure 2, the API requests are represented by the incoming arrows of the server.
The graphical user interface is a vital part of the application that allows the users to interact with the application. When design such a system we will need to take into consideration the HCI principles identified in the background section.
The tool will split into two sections – menu and content. The menu will provide navigation to the user while the content section will show the current page content.
This layout is chosen because this is the layout the users may have been accustom too. The reasoning behind this is the fact that a popular website like YouTube, GitHub and Facebook all use a similar layout. Consequently, it is highly likely that the users for this application have encountered at least one of the sites mentioned before. If this assumption is correct, then this application will be able to uphold one of the vital principles of HCI – Familiarity (section 2.7.1).
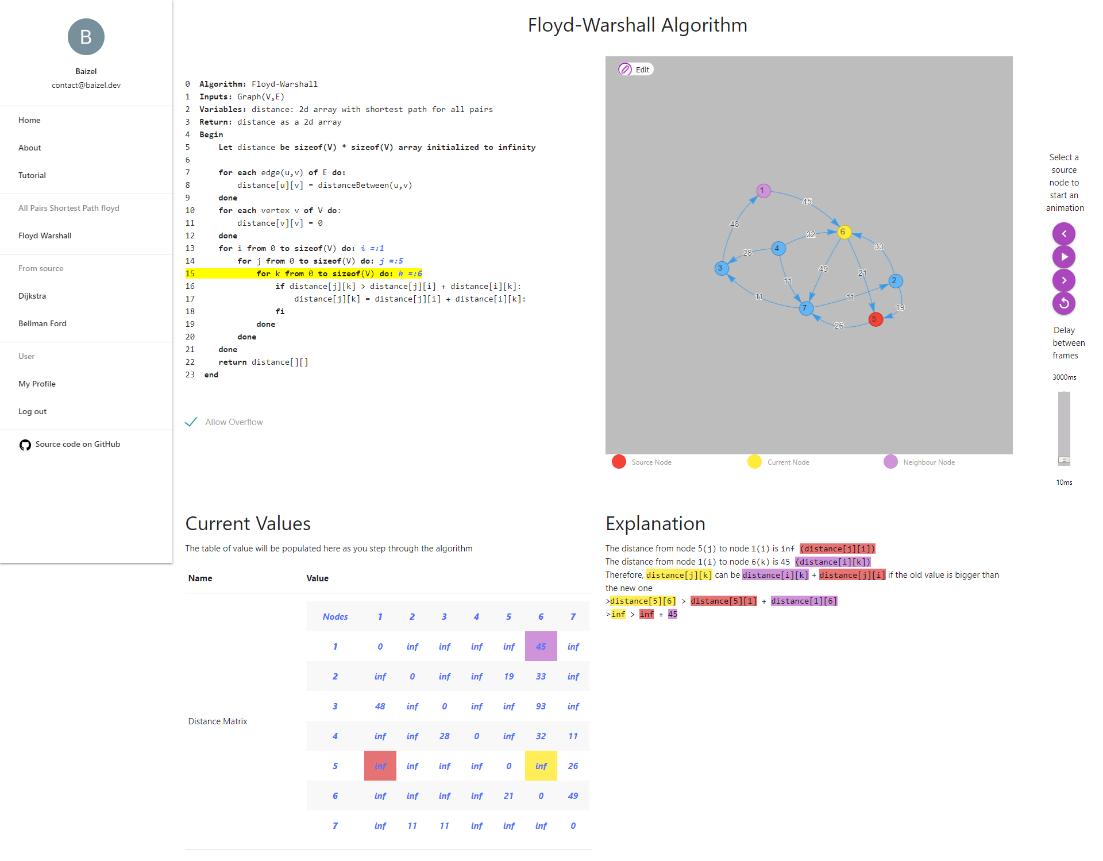
Figure 3 below shows the design of the tool when the user is using the algorithm animation part of the tool. The content section is further split into five groups: pseudo code, graph network, table, explanation and animation controls.
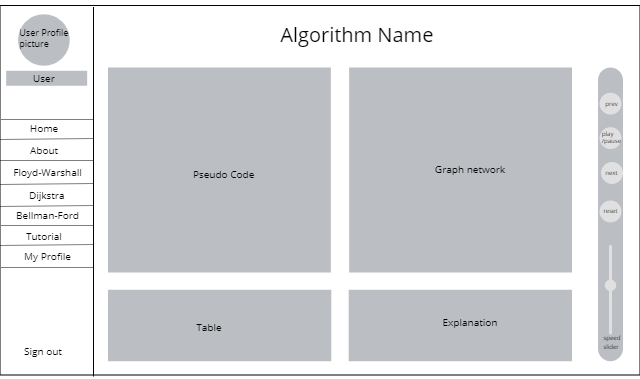
Pseudo code: Displays the pseudo code to the user, can be any of Dijkstra, Bellman-Ford or Floyd-Warshall. A line number will also be displayed for each line of code as per requirement R07.
Graph Network: The graph will be rendered here where the user will be able to interact and manipulate the graph if they so desire.
Table: This section of the page is dedicated to showing key variables that are important for the current algorithm. The variables will also be accompanied by a brief explanation and will be presented as a table.
Explanation: The explanation is an extension of the pseudo code section. When iterating through each line of the pseudocode, a corresponding description for the current line of code may also be presented to the user in this segment.
Animation Control: The animation control is accessible from the far right of the page. From here, the user has five options of control: move to the previous frame, play/pause the animation, play next frame, reset animation and speed of frame rate.
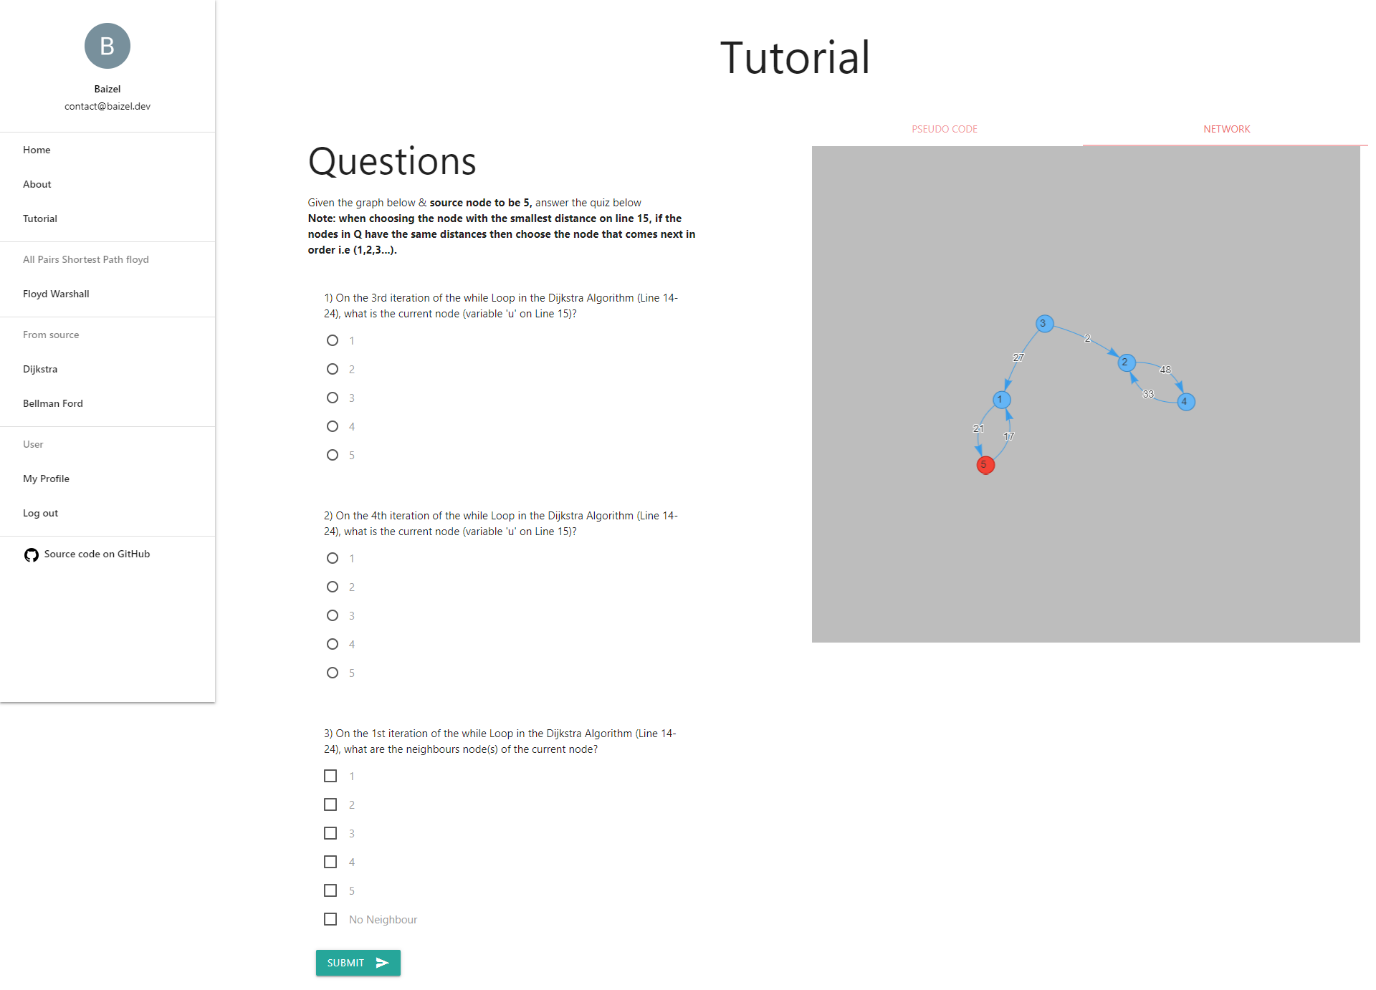
The tutorial page has a similar structure to the algorithms page as seen in figure 4. However, in the tutorial page, the content is only split into two sections – Tutorial questions and graph/code section. This page still has the same structure as the menu as seen previously.
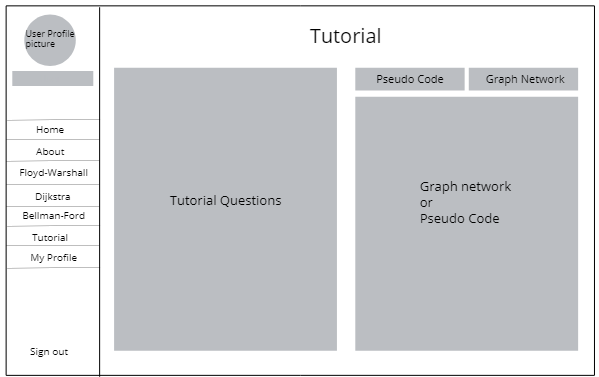
Tutorial Questions: This section will display the questions with multiple choice answers. The questions will be displayed as an HTML form with a submit button at the end.
Graph Network/Pseudo Code: This section displays either a graph or pseudo code depending on which tab the user chooses. The tabs can be seen above the pseudocode or graph network’ section.
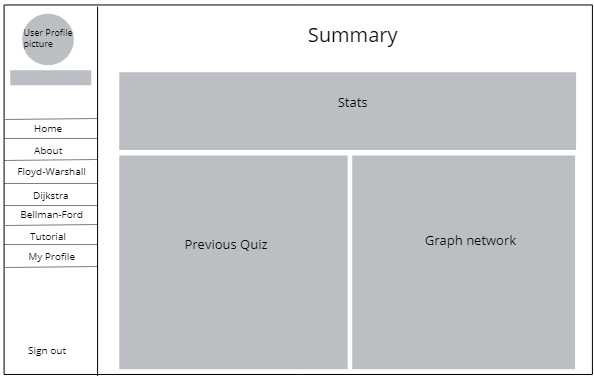
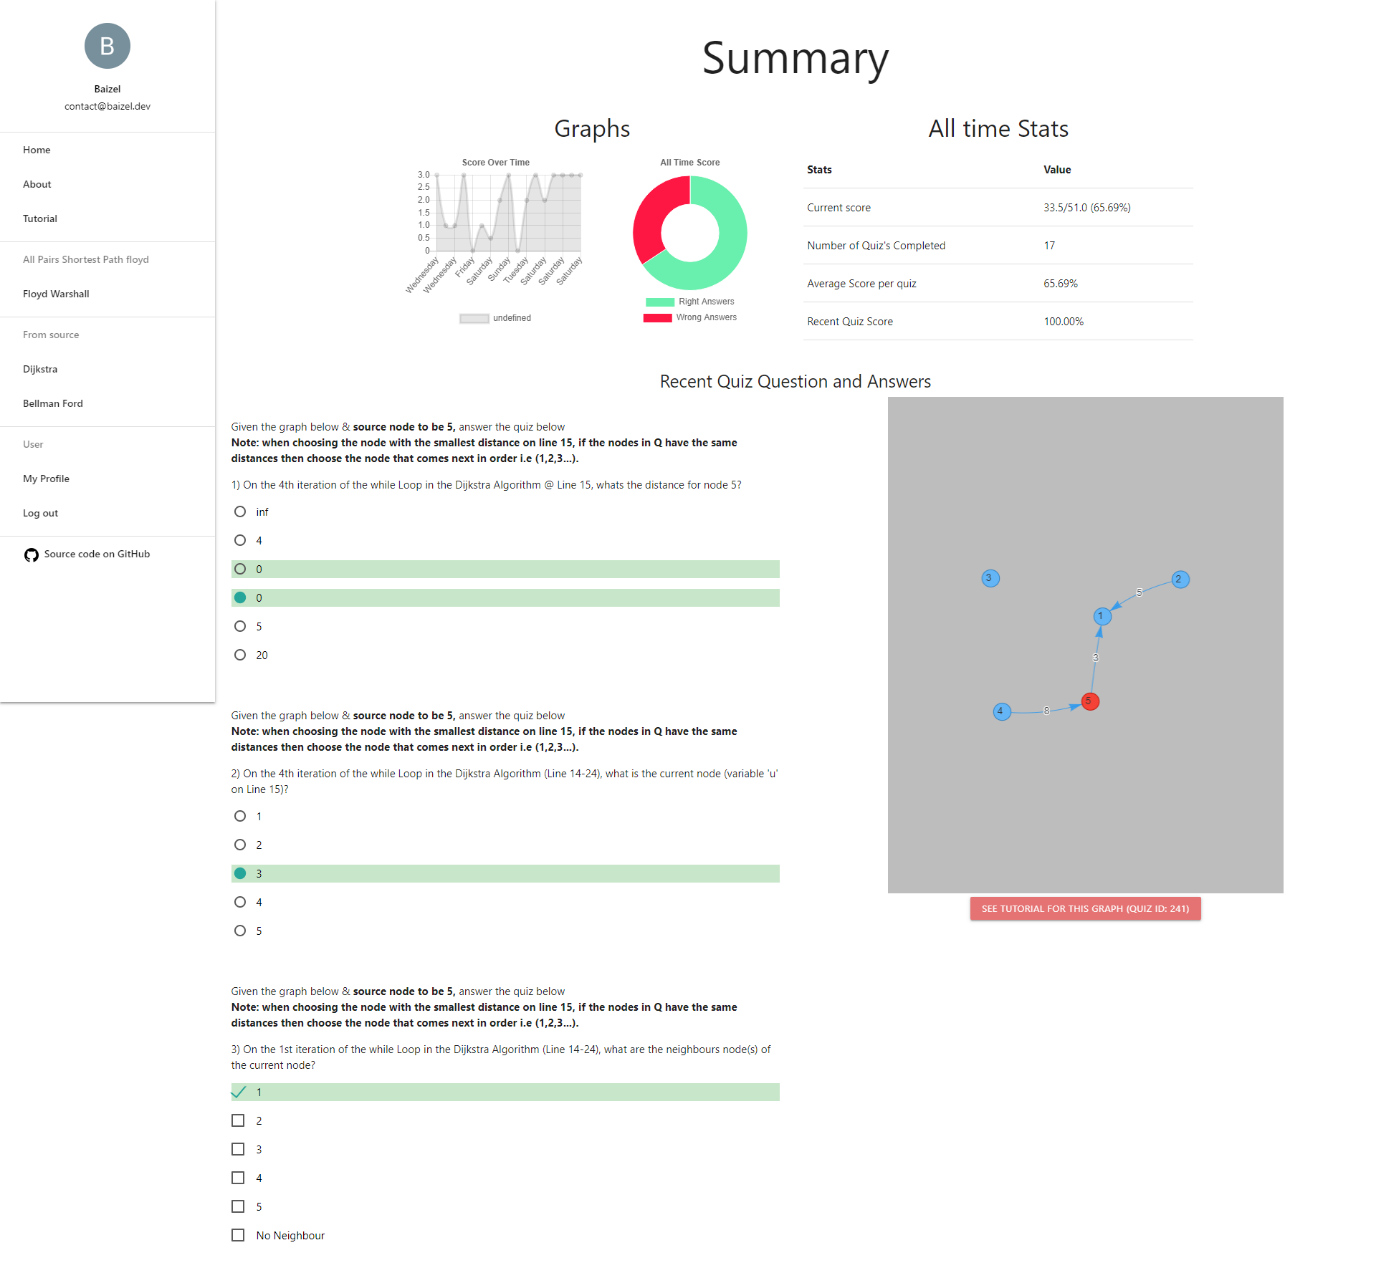
The summary page is shown to the user usually after a user has completed a quiz; however, this page can also be accessed at any time by the user. Figure 5 shows the layout for this page. Again, this page is very similar to both tutorial and algorithms page to maintain the consistency principle of HCI.
Stats: Displays the user statics for all attempted tutorials. The statistics will include a table break down as well as charts to show the progress of the user.
Previous Quiz: The user will be shown their recent previous attempt of a tutorial with the answers and their choices in this section. This section is read-only.
Graph Network: The same graph that was used with the most recent quiz will be displayed here.
Representational State Transfer (REST) is a software architecture commonly used in web applications to communicate between services. It takes advantage of the HTTP methods such as GET, POST, PUT and DELETE. Using this architecture to design the API will allow the server to take advantage of the stateless property a RESTful API provides. This will make the server easier to design as it will not need to keep track of states.
Furthermore, if the server is stateful, then the server will need to keep a constant connection with each client to keep track of states. This can take up many resources and quickly use up any bandwidth that is available as the number of concurrent users increase. This is not a problem for a stateless architecture as each request can be self-contained – we only need the data we are given. For these reasons, the API in this application will follow the RESTful architecture.
Additionally, using a RESTful API to retrieve the data from the server asynchronously will improve the overall user experience as well as making the application more extensible. The use of an API will also mean the page does not need to be reloaded every time we need to deliver dynamic content making use of the asynchronous property. Moreover, by implementing the API, we are also following one of the critical principles of HCI; Flexibility and Robustness. Retrieving data using the API uses the multi-threading property making the application more flexible.
The API will have three endpoints which will be used to retrieve and modify data.
The animation endpoint is used to retrieve animation updates from the server. The updates are then processed by the client machine to iterate through each ‘frame’ at a set speed on the client. The data structured and definitions can be found on in Appendix B.
This API requires the client to convert the graph into a JavaScript Object Notation (JSON) structure when sending the data, as well as sending a source node id for the Bellman-Ford and Dijkstra algorithms. The data is required to be sent by the client since the server is not stateful and will not keep track of what data have been requested by that client.
The Graph API is used to retrieve a generic graph from the server. From using the API, the user has two options, either retrieve a graph that the user has previously encountered in a tutorial or retrieve a randomly generated graph. The users who have not yet authenticated with the server will only be able to use the random graph method.
The random graph is generated by the server and not stored anywhere. This the graph that will be used as the data for the algorithm the user has chosen.
The tutorial API is used to mark and store a user’s score for a completed tutorial. The questions will already be present before the API request is made since the questions are generated by the server on page load. The request only updates the database with the user’s score and attempted answers. This is then later used to show a summary to the user. This way the answers cannot be leaked by the server since answers will never leave the server. However, this does mean a tutorial has to be generated whenever a page load request is received. This means it can quickly fill up with unused tutorials taking up space and reducing performance. Nevertheless, this only becomes a problem with a large user base which this project is not expected to hit at the time of development.
When implementing and designing the application, it is essential to know how the data will flow end to end. This section aims to provide an overview of the data flow for the essential features of this application.
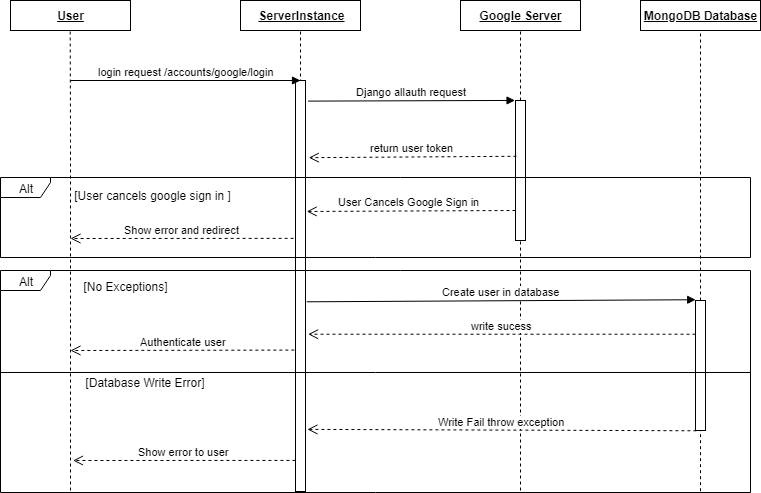
Figure 6 below describes the login process that uses Django library to authenticate with Google. The user sends a login request to the endpoint /accounts/google/login, at this point Django allauth will redirect the user to a Google sign-in page where the user will be authenticated. The authentication will return a Google token to the server. If the user decided to cancel the Google sign in, then the user is redirected back to the homepage and shown an error.
When the user has successfully authenticated with Google, it will pass a Google token back to the server; then the server will create and save the user object into the database.
The use of third-party authentication lets the application not have to worry about handling sensitive user data since everything will be handled with the library. This is especially beneficial since the library is compliant with the EU General Data Protection Regulation. This will eliminate the need for making sure the application is GDPR compliant since no personal information is stored.
The sequence of events shown in figure 7 occurs when the users have requested to view an algorithm page. When the user loads the page, a request will be sent to the server with an algorithm name. This will return an HTML page that will resemble the design shown in figure 3, from here the page will send another request to the server to generate and get a random graph that is then loaded for the user. This case applies to all algorithms, however, if the user loads the Dijkstra algorithm page and they are authenticated with the server, then the user will have the option load graphs that are associated with that account (graphs from the tutorials).
After loading the algorithms page, the user can request the application to animate the code and graph. The request will be sent through the API using the ‘animation’ endpoint to retrieve the data; this can be used to animate all the elements present on the page. The data retrieved from the server will be used to step through each ‘frame’ (see Appendix B7 for data structure) to display the updates to the user at speed chosen by the user. More details can be seen in figure 8.
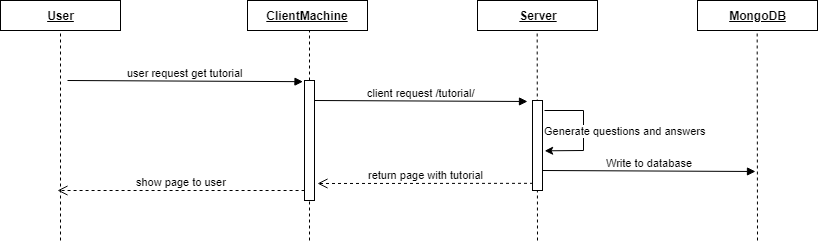
The tutorial questions are generated by the server and rendered by the client. After the page is loaded, the client does not need to send any asynchronous requests to the server to complete loading the page; dissimilar from the algorithms view page. Figure 9 below shows the flow of requests in order to complete a tutorial. When the tutorial is generated, it is first saved into the database along with the correct answers so that it can be later retrieved when marking the questions. The questions are populated into the page using the server-side templating language so that no answers are leaked through the JavaScript code.
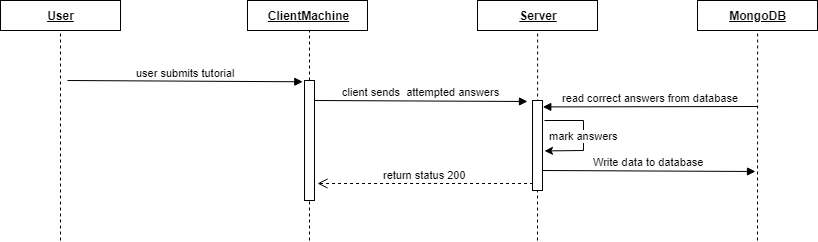
When the users wish to submit a tutorial, a request is sent to the server with the user’s answers using the API. The server then retrieves the tutorial and answers using the given tutorial id. The retrieved answers are then used to compare against the user’s answers to give the user a score. The score is then stored with the user’s id on the database, and a response code of 200 is sent back to the client machine. Figure 10 below shows the flow for this process.
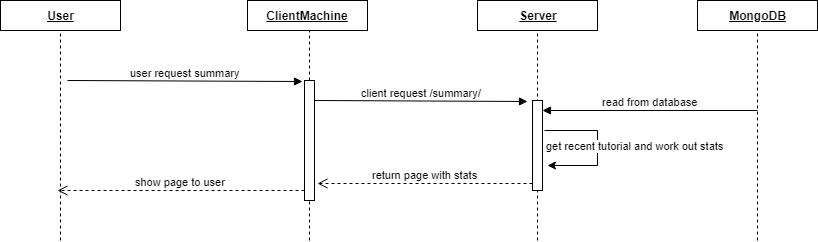
The summary view is presented to the user after completing a tutorial. Optionally the user can view this page at any time too. All the data displayed on the page is computed at the server and returned to the client as an HTML page. There is no asynchronous request send to the server after the pages loads, comparable to the tutorials page. Figure 11 shows the flow of requests handled by the client and the server.
One of the vital parts of this project is to visualise the algorithm chosen by the user. To do this, we need to design an animation engine that can be used to precisely work out what nodes, line of code, edges and data that will need to be visualised during any stage of the algorithm. Since the animation is generated on the server and then displayed to the user on the client, two designs are needed; a mechanism to generate animations and one to display the animations.
The purpose of the animation engine is to produce an output that can be used by the client to animate the pseudo code and graph network. The four components as mentioned before (nodes, line of code, edges and data) needs to be kept track off at each stage of the algorithm. We can then use that data to make up the frame object (the structure of the Node and Edge can be seen in Appendix B). This can be used as the building blocks to produce an output for the client.
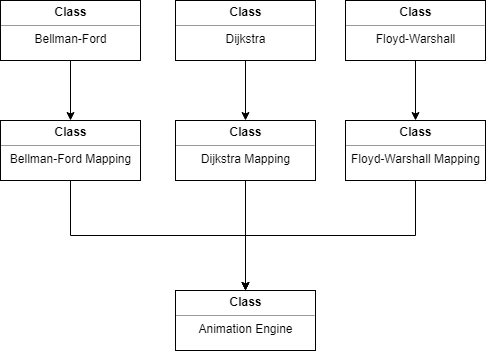
The diagram below shows a high-level design of how the animation engine will be structured. A mapping class will be associated with each algorithm class; it will have methods that will map the implemented algorithm to lines of pseudocode text. The mapping classes will be vastly different from algorithm to algorithm. Thus, each algorithm must implement a mapping system.
To put it simply, the mapping class behaves similar to a logging system. It will ‘log’ all values passed to it when invoked. At the mapping stage, first, the data gets processed and formatted so that it is human readable.
Second, the processed data is passed to the animation engine. It is then used to make a frame object, after which the engine can build up a list of frames to capture the algorithm visually. This is the idea the animation engine will use to create the animations for all three of the algorithms. Figure 12 outlines the class hierarchy for the animation engine.
[fig:2_Animation_engine_class_hierarchy]
The client is responsible for displaying the animation portion of the application. It will need to use the data given by the client to animate both the pseudo code and the graph as well as keeping any other data displayed to the user up to date.
To display the node and edge, the client can update the graph via vis.js by merely providing the library with the frame data given by the server. This is because the server should use the same structure for the edges and nodes as vis.js. Therefore the client will not need to parse the node and edge data. This is to reduce the need for converting the data when wanting to use it in vis.js. By using the same structure, the same data can be used throughout the whole system without the need to convert between server-side objects and client-side objects and vice versa.
The quiz engine is used to create the tutorials for the application. The quiz engine needs to generate random question each time the user wants to complete a tutorial. For this application, the quiz engine will only be used to generate questions for Dijkstra’s algorithm since it is one of the key topics covered at Newcastle University.
The quiz engine will have three types of multiple-choice questions. The type of questions includes finding the distance of a node for a random iteration, finding the neighbours of a node and finding the current node at a particular iteration. These types of questions have been chosen because these are the concepts the user is required to know in order to comprehend the Dijkstra algorithm fully.
To generate these questions the quiz engine should use the animation engine to work out the states of the nodes and distances at any given iteration of the algorithm. The states can be used by the engine to generate questions where it can be saved into the database with the corresponding answers.
The implementation phase of the software engineering process is where the project is brought to life. The implementation will follow the design that was discussed earlier. This section will aim to go into detail about the implementation of the project and explain why the choices are made.
The project uses some concepts of agile methodology for the development of this project. Even though there are no stories or sprints, the project splits features into small manageable tasks to be implemented. As well as this, using the agile methodology allows continuous testing and therefore finding and fixing bugs much quicker.
Furthermore, this project uses GitHub for version control and general project management such as tracking any ongoing issues, features and bugs. Git is the standard for version control for most of the industry. Therefore, it would be good practise to use it whenever possible.
Before diving into the details about the system, it is a good idea to understand the whole system as a whole. Figure 13 shows an overview of the system using a unified modelling language (UML). However, some things are missing from figure 13 such as an overview of the client-side animations and class diagrams for the Django models. The client uses procedural functions as it is event-driven. Therefore it will not be beneficial to include them in the UML diagram. The second item missing from figure 13 is the Django models, this is because the models represent the database tables, but the models will be represented by an entity relation diagram which is shown later in this chapter.
System Overview
The system needs a way to interact with the pseudocode for each algorithm. Several possible solutions are possible to solve this problem. One option could be to merely hard code in the pseudocode for each algorithm in the source code of the application. However, this can become unmaintainable if the project was to be extended to facilitate more algorithms in the future. The solution was to store the pseudo code as a text file, exactly as how the user would see it. By using the text file, we can also use identifiers such as // to add comments in the pseudo code that can be extracted and separated to show the user. An added benefit of the text file approach is that when extracting the code from the file, we can add an incremented line number for each line of text.
Figure 14 shows the Dijkstra algorithm pseudo code in a text file. The file is annotated with comments by appending the comments to the line of text using the // identifier. The code can also be formatted using HTML tags to emphasise
built-in functions or vital elements of the algorithm.
Figure 15 shows the code used to read in the text file to extract the lines of pseudo code and comments. The extraction method allows manipulating the pseudo code to add extra functionality. For example, in figure 15 we are adding a span tag with a class attribute of data. This can be used by the client to inject variable states into each line to display an inline value to the user; an example of this can be seen in Appendix C.
[fig:4_Dijkstra_Pseudo_Code_Text_File]
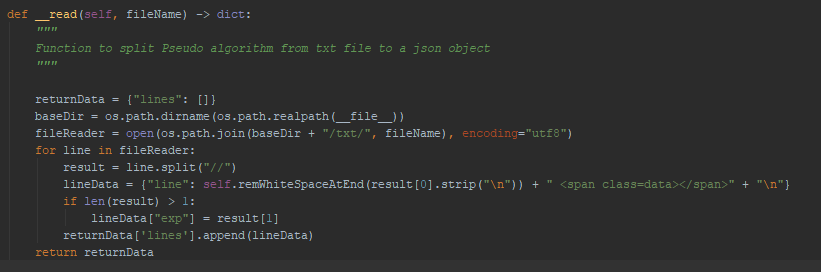
[fig:5_Pseudocode_class_read_function_]
The goal of the animation engine is to provide an interface the client and server can use together; the engine provides the generated animations to the client. The actual animation data is generated using the mapping classes (see later); the engine only takes this data and creates a structure the client can understand. Keeping the data structure consistent is not an issue for languages that have strict types; however since python does not enforce typing, this issue has to be addressed. Additionally, a mutable dictionary object is used to store the data for the frames; this can again lead to errors if the structure is not adequately managed. The best way to solve this issue to only have a single point in the system to manage the animation data – the animation engine.
To keep the frame object consistent, the only way to record an animation is to call the method addToFrames from the animation engine. This method will use the data passed to it to create the frame object. Figure 16 shows the process of creating the frame and appending that frame into a list of updates to keep the order of the updates. One more functionality the AnimationEngine does is that it keeps a list of node and edge states that can be used later by the QuizEngine. The node states are a collection of all the nodes passed to the AddToFrames function.
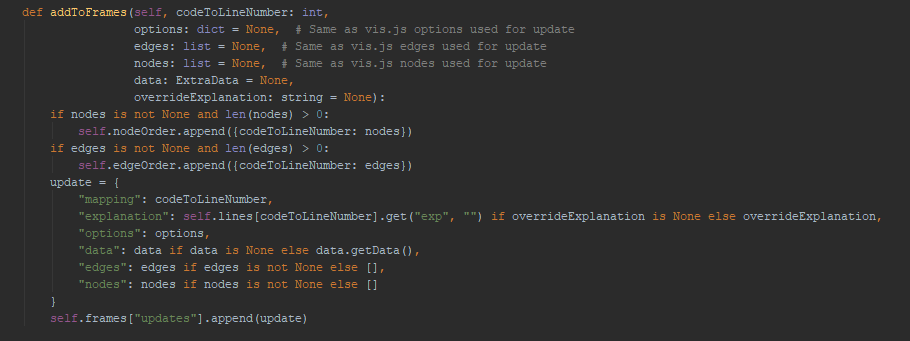
[fig:6_AnimationEngine_addToFrames]
The animation engine uses an ExtraData object to add data into the animation engine. The ExtraData object is used to define structure the client can use to update the data. Figure 17 shows the code used to implement the data structure. When constructing the object, a class id and value must be passed. This class id will be injected to the HTML code as a class attribute so that all instances of the same data can be identified by the client. The value parameter is the data shown on the screen. Optionally the user can also choose not to display the value inline, instead update all instances of the data with the same class id. The class id attributes are used as it allows the JavaScript to code to easily query all HTML tags with the same class ids.
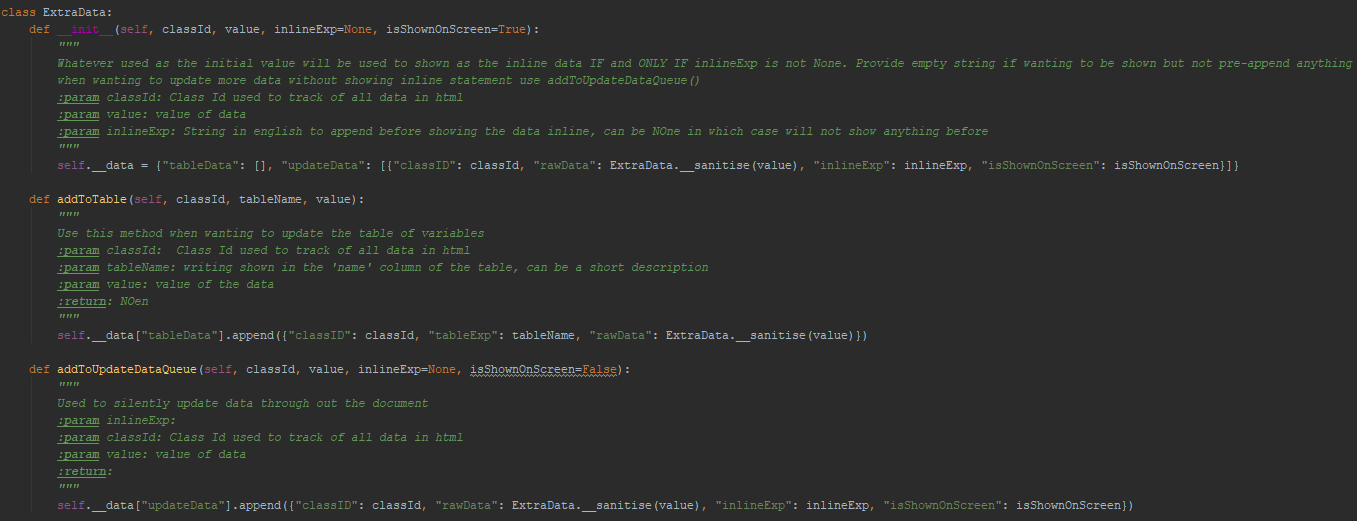
[fig:7_ExtraData_class]
The pseudo mapping classes are required for any animation to work. The classes are concerned with generating data that is used to animate the graph and update the data shown on screen; a mapping class must be present for all algorithms. Currently, in the system, there are three mapping classes, one for each algorithm.
As described before, the mapping classes act as a logger to capture the state of the algorithm for every iteration. The mapping class achieves this by mapping the line number to the pseudo-code. It also maps the associated data to show the user the current state of the algorithm.
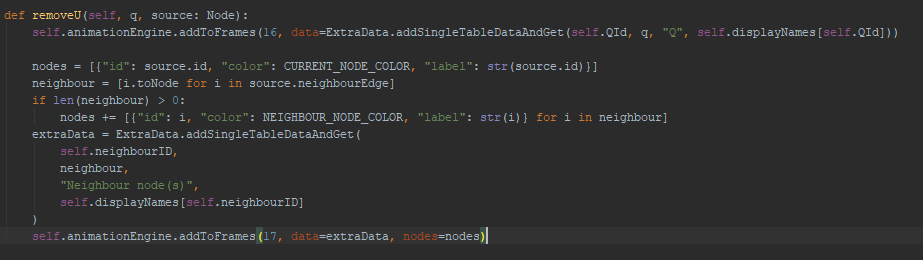
An example of the
DijkstraPseudoMapping
class can be seen in figure 18. The mapping class passes the line number and its associated data to the animation engine for each frame. The example below maps lines 16 and 17, figures 19 shows the line of pseudo code the numbers represent.
The use of the mapping system allows the system to capture the state of the algorithm automatically if the algorithm is mapped correctly. This uses ideas from both state driven animations and dynamic program visualisation techniques described in the previous background section. The actual data is gathered at runtime of the algorithms to capture the state of the algorithm at each iteration.
However, this method is highly error-prone and difficult to maintain if the line number of the pseudocode ever changes. If there is a mapping error, it will not be detectable programmatically. Instead, it must be detected manually. This is not reasonable if the project was to add more algorithms, but for now, we can verify the system manually.
In hindsight, a better solution may have been to map the text of the pseudocode instead of the line number. This way if text changes and the mapping cannot find a matching text in the pseudocode object it can throw an error. Moreover, if the line number changes it can automatically be updated since the text will return the correct line number.
[fig:8_Dijkstra_Mapping_Example]
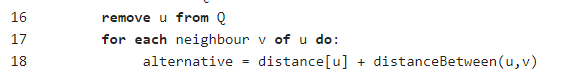
[fig:9_Lines_of_Pseudo_Code]
The graph structure is an integral part of the whole system. The graph is the input for all three algorithms as they rely on the graph to be able to solve the shortest path problem.
Three primary attributes make up a node: id, label, neighbour edges. The label is used to visually identify the node whereas the id is used to identify the node programmatically. The neighbour edges are a list of edge objects that are neighbours of the said node.
Storing the neighbours is useful when implementing Dijkstra’s algorithm, and cases were traversing through the neighbour is needed. There are two ways to approach storing the neighbour data; store the neighbour nodes in a list or store only the edges connected to the neighbour. The above method does not store the distance of the node unlike the later. The former approach is preferable when only nodes are needed for the neighbours, but the second approach is usually better suited for most applications as the distance is also required when needing the use of neighbour nodes.
The edge objects have five attributes that are used to represent a single edge: id, label, fromNode, toNode, distance. The ‘from’ and ‘to’ node are string ids of the nodes that represent the start and end of the node respectively. The ‘from’ and ‘to’ attributes could have been node objects, but this requires finding the node when initialising the edge. This structure of the object was taken from the vis.js dataset API with only adding the distance attribute as extra data.
These are the two objects a graph is made off. A graph object contains two sets of nodes and edge objects; which uses the structure described in section 2.1
The Dijkstra algorithm is implemented to be used for finding the shortest path and mapping the animations. The algorithm is implemented in python using the pseudocode described in the background section as the guide.
Figure 20 shows the implementation of Dijkstra’s algorithm. One of difference between the pseudo code and implementation is the method of getting the distance between two nodes. In the pseudo code, a distanceBetween function is used to calculate the distance, but in the python code, the distance is accessed directly from the edge object. It was implemented this way because the distance is always provided for an edge when receiving the data from the client, so there is no need to store the mapping between the edge and distance, saving memory and time.
Another difference is the data structure used to store distances is a dictionary, where key maps to value. The keys, in this case, are the nodes in the graph and values are the actual distances for that node. The dictionary is used instead of an array because when using an array, we assume the index of the array corresponds the node, i.e. if we had distances[0] then we assume that would return the distance for node 1. However, this is problematic if a node is missing from the graph, and therefore now the node does not relate to the index of the array. Furthermore, in a Software Engineering perspective, the assumption when using an array can be very confusing when reading the code or trying to use the codebase. For example, given the nodes 1,3,4,6 then finding the distance of node six will be challenging as an index of 5 will throw an exception in this case. On the other hand, using a dictionary that maps key and value will be much easier to understand and use since the index of node six will map to value. i.e. distance[Node(6)] will return a value.
Through the algorithm, there are mapping statements to keep track of the state of the algorithm. As explained earlier the mapping statements create the animation data using the values passed from the algorithm as shown in figure 20.
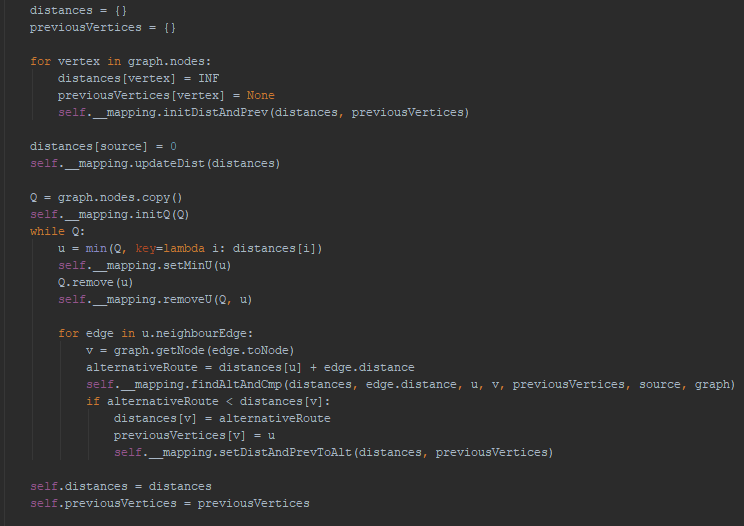
[fig:0_Dijkstra_Implementation]
The implementation of the Bellman-Fords algorithm is akin to the Dijkstra algorithm with only a few modifications. Figure 21 shows the full implementation of the bellman fords algorithm. The same techniques described for the Dijkstra algorithm are also used in the implementation of Bellman-Fords.
[fig:1_BellmanFord_Algorithm]
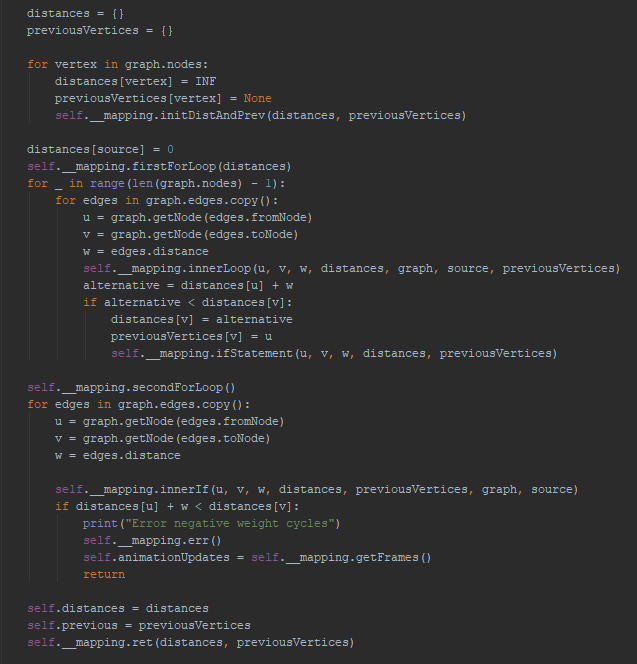
The implementation of the Floyd-Warshall follows closely with the
pseudocode described in the background section. The only difference is
the pseudocode uses a 2d array to store the distances whereas a 2d
dictionary is used in the code. The 2d dictionary essentially creates a
matrix where
is the
number of nodes. To get the distance of and edge, we use the following
notation distance[fromNode][toNode].
Since Floyd-Warshall uses a node matrix for distances instead of a
single dictionary, it was easier to visualise the data if they were
tabulated and presented as a matrix. The distance data is processed
using a helper method called makeHTMLTable when passing the data to the
mapping class. Figure 22 shows the implementation of this method. The
function creates a table with the size of
and
populates it with the data from the distance matrix.
Optionally the function also accepts the three nodes: i, j, k. These variables are used to colour the cells to show what nodes are used in that step of the algorithm. In this algorithm, we set a cell of the table the colour of the current node when we find nodes that are the same as j and k. This is because in Dijkstra and Bellman-Fords we have defined the current node as the node where the distance is being written to, i.e. the node in set Q in Dijkstra. In Floyd-Warshall the current node cells are j, k. The selected node is source node which are all the cells with j, i. The neighbour nodes are all cells with i, k.
Figure 23 shows the full implementation of the Floyd-Warshall algorithm.
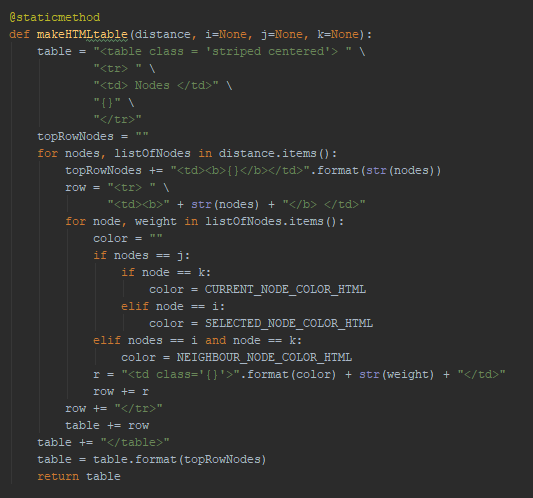
[fig:2_FloydWarshall_HTML_creator]
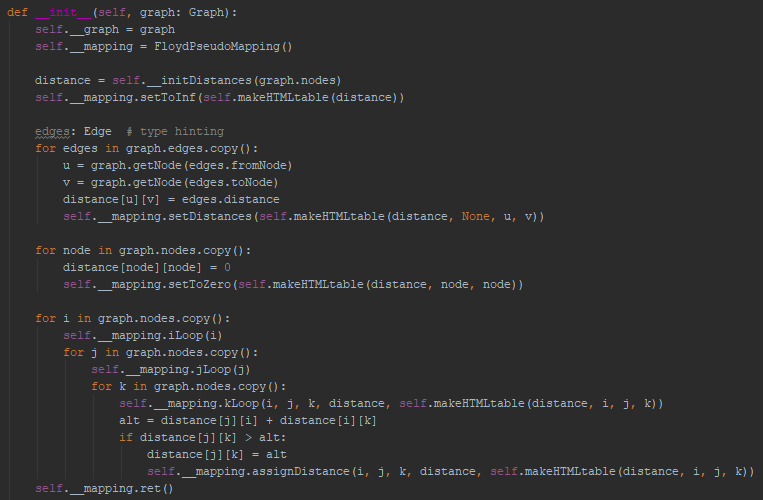
[fig:3_FloydWarshall_Algorithm]
The tutorial part of the application generates questions and answers using the QuizEngine and then saves it to a database. It is the only part of the application that uses a database. The database stores users, questions, scores and attempted answers.
The quiz engine takes advantage of the animation engine to generate
question and answers. As seen previously, the animation engine stores
the node states. This gives us a way to figure out the state of the
network at any given iteration of the algorithm. To do this, we can
exploit the implementation of the Dijkstra mapping class. We know in the
Dijkstra mapping class there are only two places in the class where node
states are modified; setMinU and removeU (see figure 18 and Appendix D).
Since both these methods are called on every iteration, we know the node
state list will have a size of 2 since the main while loop in Dijkstra
only iterates once for every node. We also know the order of the methods
called is setMinU then removeU, ergo given any iteration up to the
number of max nodes, we can figure out at what index of the node state
will contain the node that is removed
iteration 2
for the smallest node. In addition, we also know the removeU functions
include a set of neighbour nodes as the parameter and thus stored in the
node states list. We can use this to work out the neighbours at any
given state. The code to achieve this can be observed in figure 24.
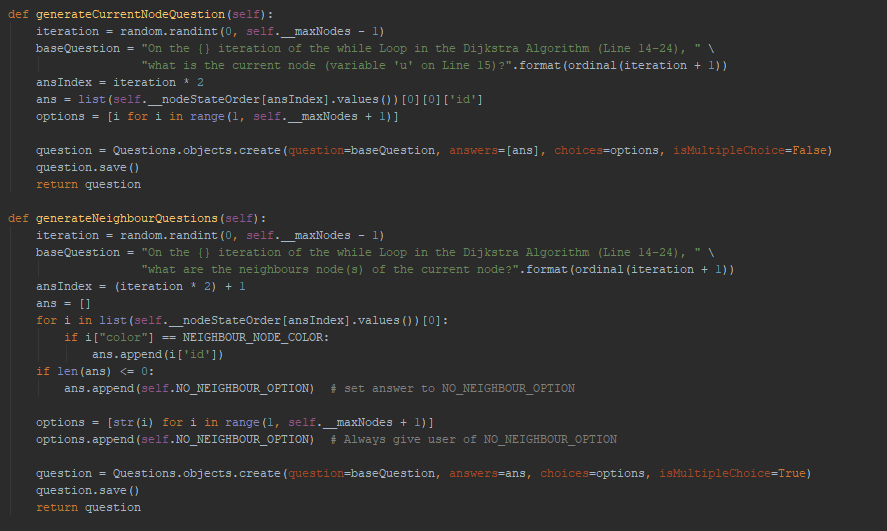
[fig:4_Generate_Questions_functions_]
The list of questions presented to the users is randomly generated using the functions described above. The generator function uses the class states to generate a Question object. The Object represents a row in the table using Django model classes. More details on the database can be seen below. In the figure below shows the code that is used to compile and present the questions to the user. The questionGenerators is a list of functions that will be chosen at random to create a question. It was implemented this way so that more questions generators can be added in the future if needed.
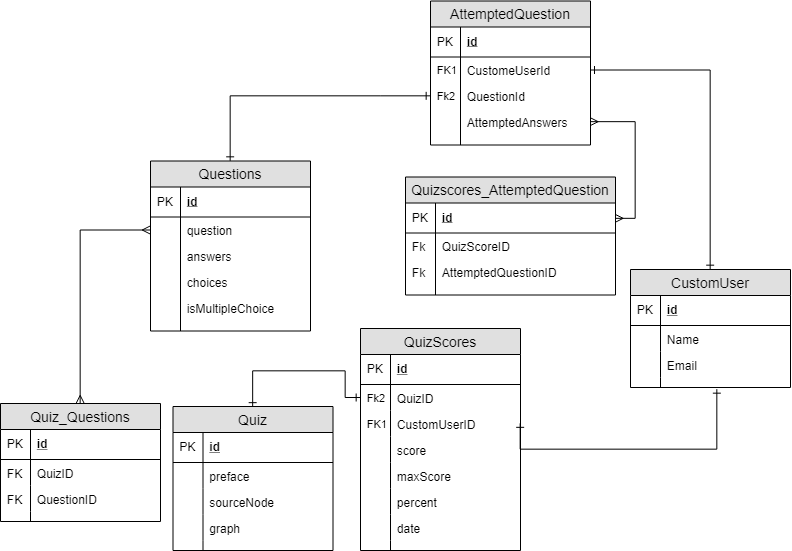
Figure 25 shows the entity relationship diagram for the database that Django produces automatically. The Quiz and Question object have a many-to-many relationship which is stored in a separate table called QuizQuestions. This table is generated by the Django models. The QuizScores and AttemptedQuestions also have a many-to-many relation which also requires to create a separate table
QuizScoresAttemptedQuestions
. The design of the database was automatically produced by Django when laying out the model. In the implementation of the models, the many-to-many relations are stored as a list.
[fig:5_Entity_Relation_Diagram]
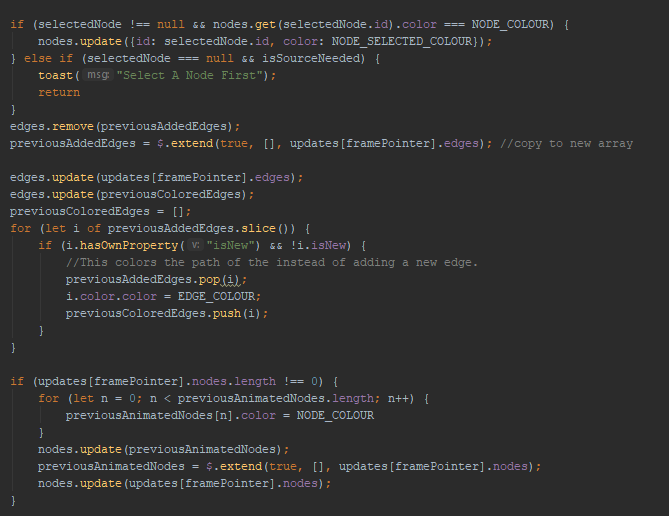
The animate function is called whenever the client needs to repaint the graph or pseudo code as well as update any of the data displayed to the user.
First, the function updates the current node to a predefined colour. This to tell the user which node is currently being operated. This will correlate with the data displayed to the user.
Secondly, the function will remove any extra edges the animate function added to the graph in the previous iteration by removing all edges stored in a list previousAddedEdges. The set of new edges given by the server to be displayed is then copied to the same variable. The graph is updated with an edge contained in previousAddedEdges. The same technique is also used for the node, but instead of deleting the node a default colour is set instead of a new colour. It was decided to use this technique since it allows animating more edges or nodes outside the animate function while still resetting all the data in the next frame. This can be desirable if another animation is required for an algorithm in the future. Figure 26 shows the implementation.
[fig:6_Node_and_Edge_Highlighting_implementation]
Thirdly, the function highlights the pseudocode by using the frame pointer as reference. The colour of the line[framePointer-1] is removed while line[framePointer +1] is added. This was by far the simplest means of implementing the pseudocode highlighter. Keeping the code simple as possible is one of the core principles to flow when developing any piece of software.
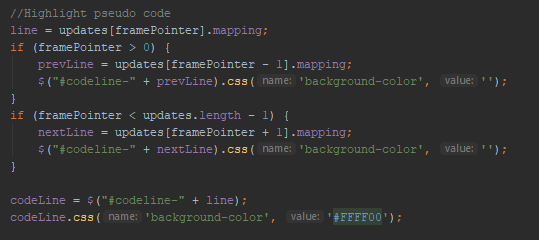
[fig:7_Pseudocode_highlighter]
Finally, the data given for the frame is updated using the updateData function. This function takes in the parameter classId and data. The function then finds all HTML tags with the same class id as the parameter and updates it with the given data. After that, if the isShownOnScreen variable is set, then the class id attribute is injected to the span tag contained in the current line of pseudocode. An inline explanation string is then created and then updated with updateData function using the string as the data parameter. The modularisation of the function allows it to be used from anywhere in the client.
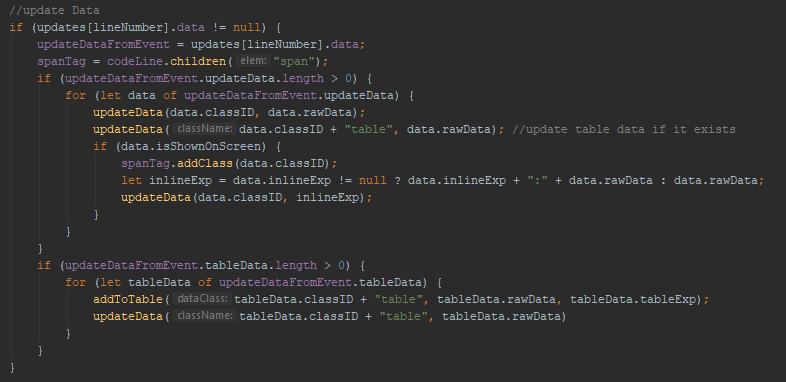
[fig:8_Update_Data]
One of the main features of the client is to provide animation control to the user. This includes stepping both forwards and backwards through the animation. To accomplish this level of control the client uses a frame pointer. As we can see in figure 29, we increment or decrement the current frame pointer in order to animate the correct frame. This way we do not need to keep two lists of previous and next frames. Using framePointer dramatically simplifies the process of animation on the client.
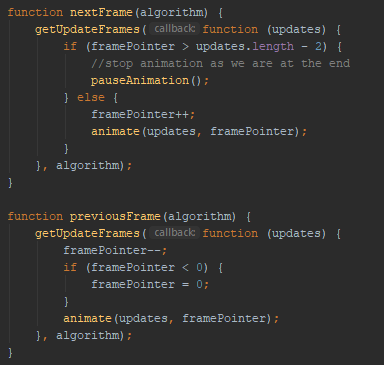
[fig:9_Animation_Control]
Since the application uses Django, the system takes advantage of the Django templating language (DTL). DTL is used to express presentation and not programming logic. It allows mixing HTML with programming code to create templates that can be reused.
For the application, every page is an extension of a base HTML page (See Appendix E). The base page defines the layouts for all pages in the application. The page that extends the base page only needs to be concerned with populating the content. This keeps the layout consistent through the application helping us achieve the consistency principle previously described in the HCI section.
The algorithms are all based on a single algorithms page where the only variable is the pseudo code which is populated by the python code. From a software engineering perspective, the single page allows reusability and reduce code duplication. This is a desirable property for all software systems.
The figure below shows the final implementation of the Dijkstra algorithm. The Bellman fords algorithms are also the same as shown below; the only difference is the title and the pseudo code. This is because both the algorithms are very similar in structure and use almost the same principles.
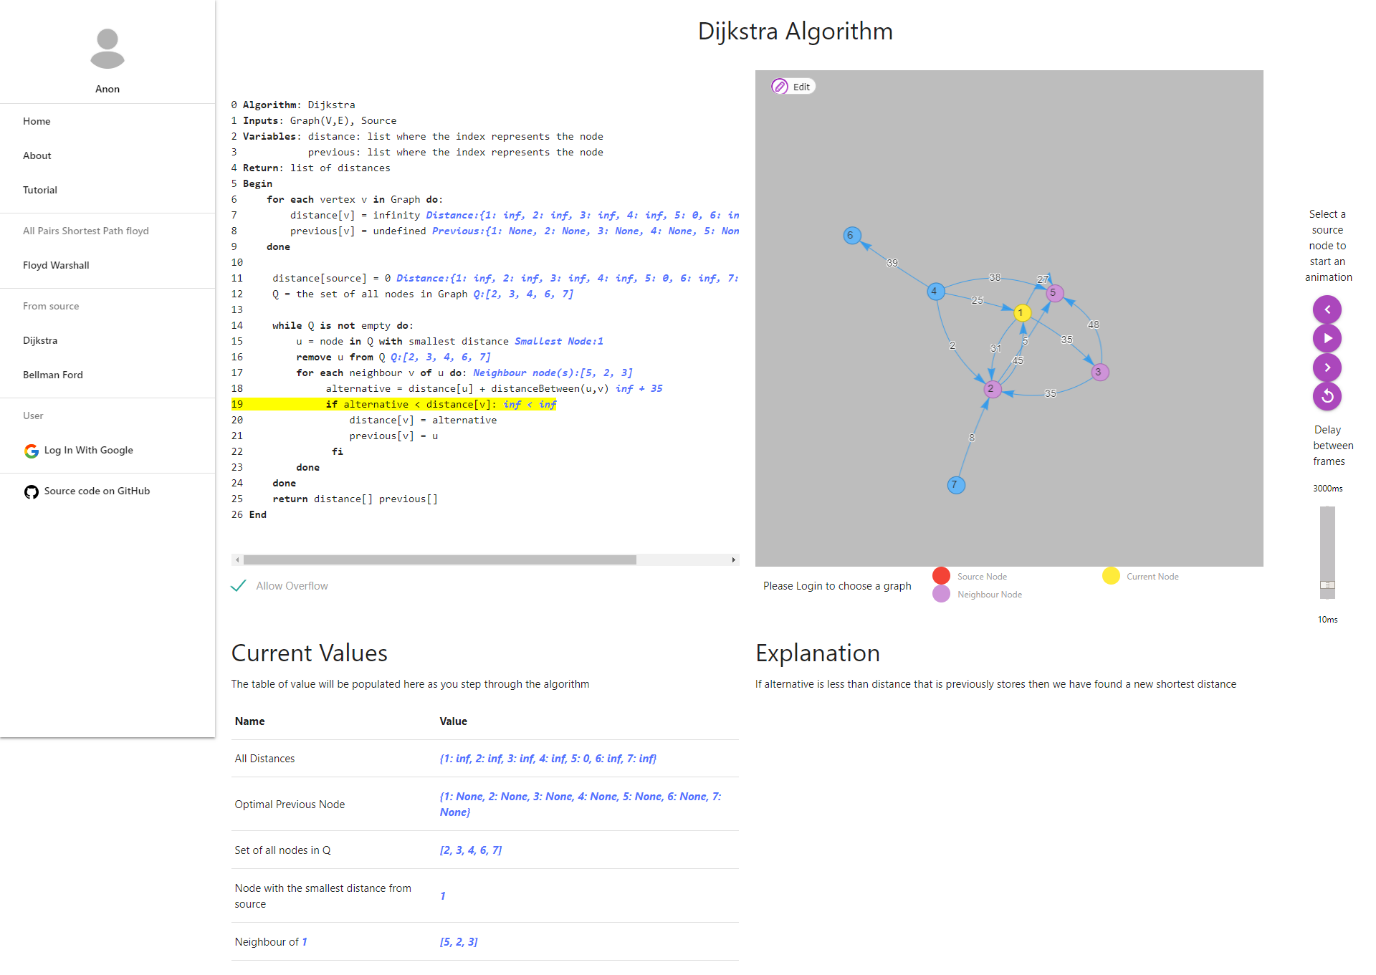
[fig:0_Dijkstra_Algorithm_View]
Figure 31 below shows the Floyd-Warshall algorithm GUI interface. This is slightly different in the fact that the data used by the server is a dictionary matrix, unlike Bellman-Fords and Dijkstra. The HTML, therefore, displays a matrix table of values. It was decided to use a matrix table because this made the most sense to visualise the data. The same colours were also used to keep them consistent; in retrospect, different colours should have been used since the same representation does not apply to Floy-Warshall.
The tutorial GUI is implemented as per the design specification described in section 3.5.2. The graph is placed to the right of the page since this is where it is previously placed. This is to keep consistency across the system to conform against the HCI principles.
As explained in the design of the tutorial, there are two types of questions: multiple choice or a single answer. Multiple choice questions are indicated with checkboxes while single answer uses radio buttons; the standard for all forms in HTML. Using the standard gives the user a familiar interface they would have been exposed to, before using this system. This is one of the principles described in the HCI section. Figure 32 shows the final implementation of the GUI.
[fig:1_FloydWarshall_View]
The summary view is a read-only page. This is where the user sees all the statistics for their profile. As seen in figure 33, the user is presented with two charts: a line chart and a pie chart. The line chart shows the user score over time. This is shown to the user to give the user an overview of their progress on the app. The pie chart shows the total score for all completed tutorials.
The summary page also shows the user the correct answers as well as the choice the user made for the most recently completed tutorial. After completing a tutorial, the user is redirected to the summary view so they can evaluate their performance for that quiz. The user can use this information n to work out why they went wrong as well as using the same graph to animate so they can see exactly how the algorithm works.
The final phase of the project is to test the whole system to find any unexpected behaviour or errors that are present in the system. Although constant testing was performed during the development cycle, through means of both manual and automation, no system can be bug-free.
Testing the system against the requirements will be useful to evaluate the overall progress of the project.
Due to the time constraint of the project, it was challenging to build a testing framework to test the animations. This would require a lot of development time which was not available for the project. However essential features of the system such as the correctness of the algorithms are unit-tested (see Appendix F1).
In addition, two main testing strategies are used for this project. The first one is testing the system against the requirements described in chapter 3.1. This testing can be used later to evaluate the system as well as give an overview of what was achieved.
The second strategy is user testing during the final development phase. This involves inviting a small group of users to use the app before it is fully released to everyone. This will lead to the users finding any bugs or flaws in the system that can be quickly addressed. Often in the industry, this is referred to as beta testing. For this project, a group of three people were invited to test the app. Due to the time limit, the users were directly reporting the bugs to the developer through instant messing services instead of raising issues through the project repository. If there were more time available bugs would be reported and documented to produce metrics.
Nevertheless, the testing was instrumental as it highlighted some critical flaws in the system the users found frustrating. An example of such a bug is when the screen was flooded with an error message when a node was not selected (See Appendix F2). The tester was able to capture a screenshot and inform the developer where the issue was pinpointed and resolved.
The table below shows the manual testing that has been completed to test the system against the requirements provided in chapter 3.1.
From the testing performed in section 4.10, the results have shown to be very positive. All but one requirement, R14, was met during the testing phase. This was mainly due to time available for this project; optimising the application for all different screen sizes require a significant amount of development effort. Although the vital features like animation and tutorials work on smaller screens, they have much room for improvement as suggested by user feedback (see chapter 6.3). The main problems on mobile platform revolved around the graph network, where the users were not able to scroll through the page when the graph was displayed.
Rate your
understating before and after using the
tool.
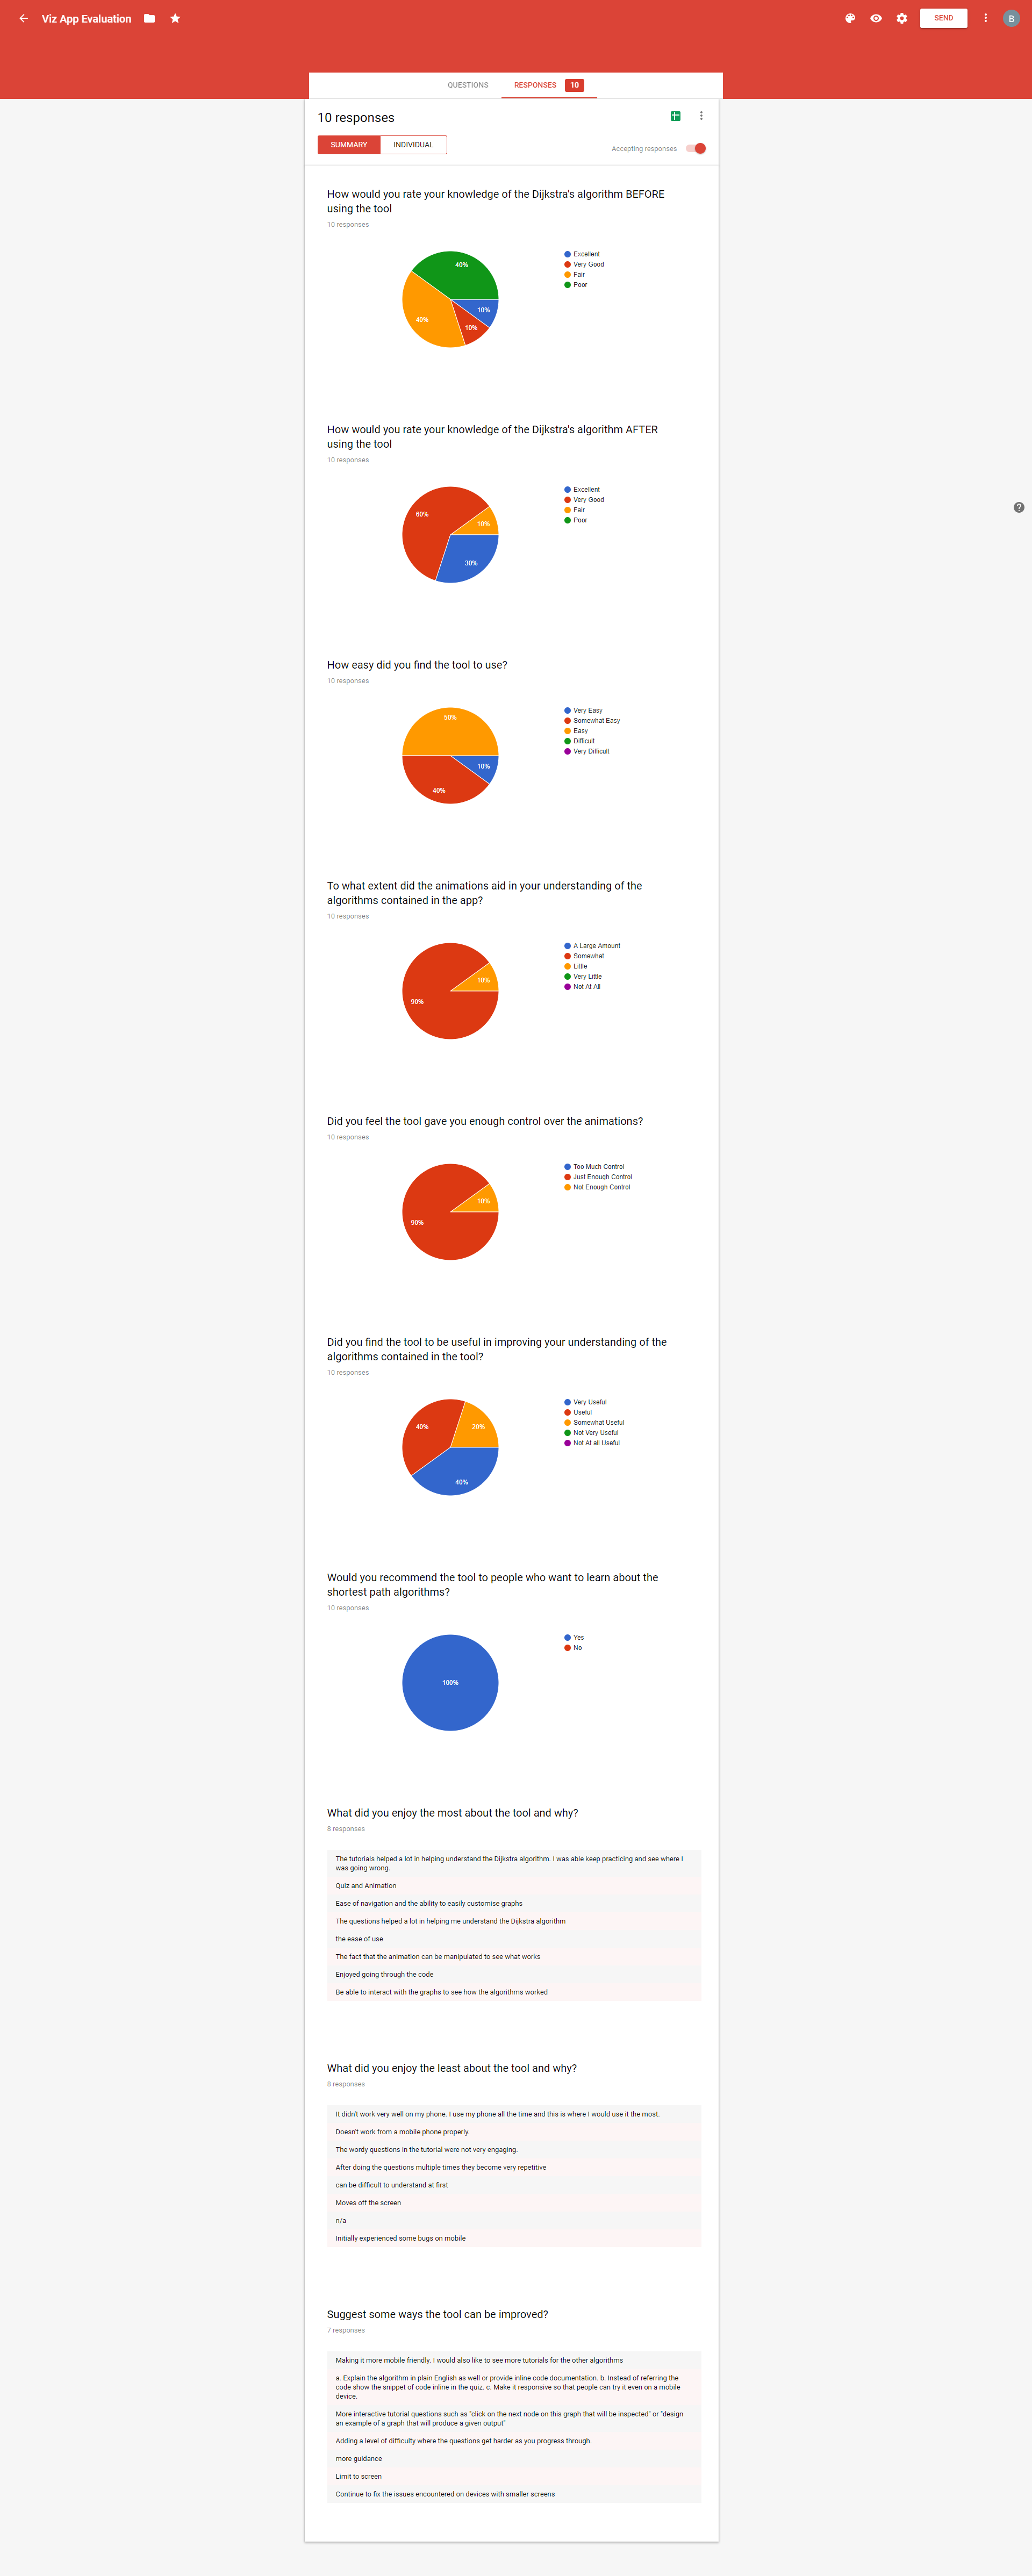
This project aimed to create a tool that will help users understand
algorithms further. In order to evaluate this, the users were asked to
rate their knowledge of the Dijkstra algorithms before and after using
the tool. As seen in figure 34 we can see
82 (9/11) of
users have said their understanding of the Dijkstra algorithm has
improved. The rest of the users understanding of the algorithm has
remained identical. This suggests the tool was successful in helping
users understand more about the algorithms contained in the tool.
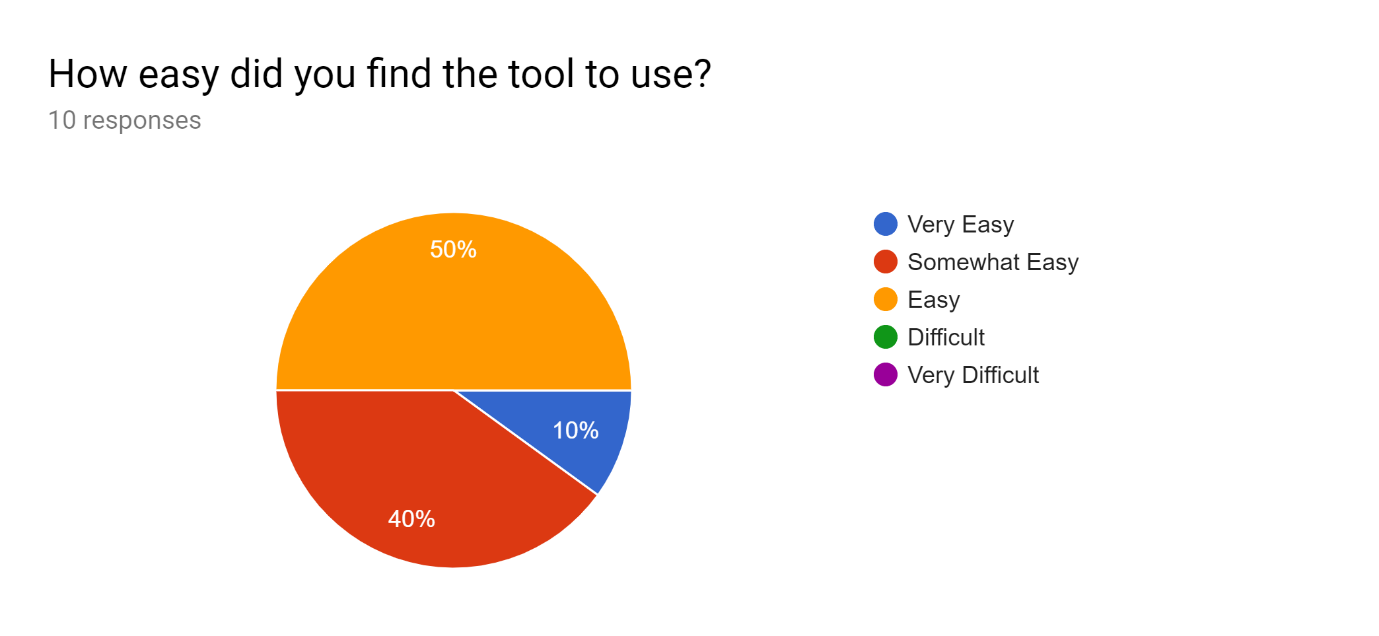
How easy was
the tool to use?
Out of the ten people who responded,
90 of them
found the tool to be ‘very easy’ or ‘somewhat easy’ to use the tool.
This is a very positive result in showing the HCI principles used in the
system creates a very useable system.
[fig:5_Usability]
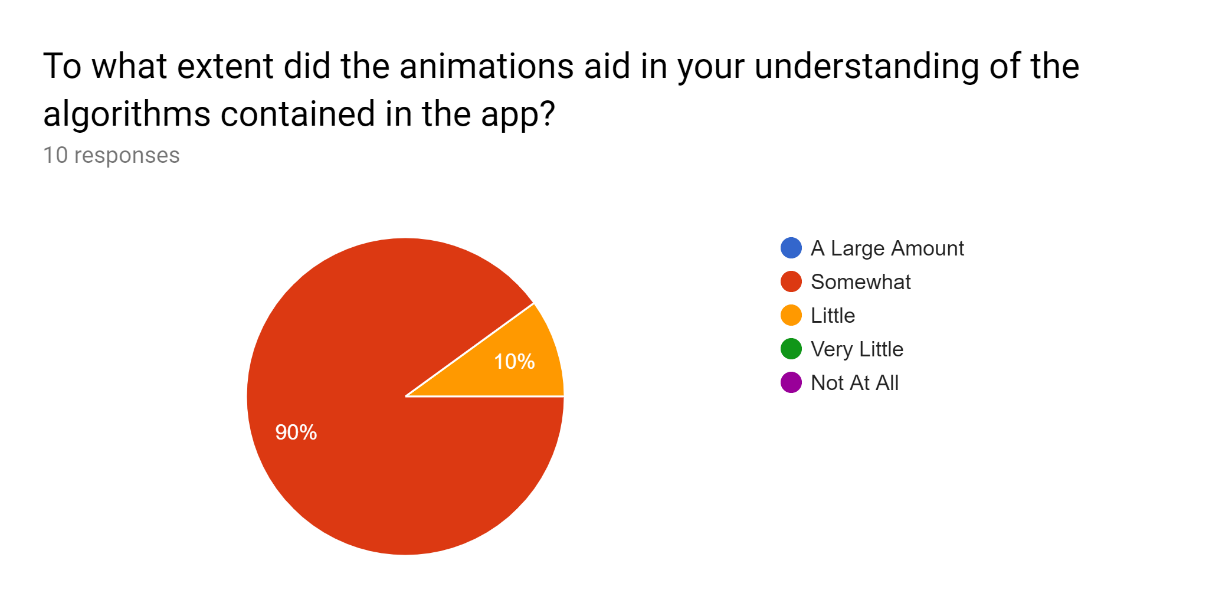
To what
extent did the animations aid in your understanding of the algorithms
contained in the app?
This question was asked to see if the animations had any impact when learning about algorithms. From figure 36 we can see the animations were only ‘somewhat‘ to ‘little’ use when used to help understand algorithms. Though animation may not be a significant factor when learning about algorithms, we can see animations still contributed to the learning process.
The users also had nothing to compare the current system with which may also skew the results. An alternative system with no animation should be presented along with the current system to get gain more accurate results. The users should then be surveyed to see if the animation had any contribution when learning the algorithm.
[fig:6_was_animation_useful]
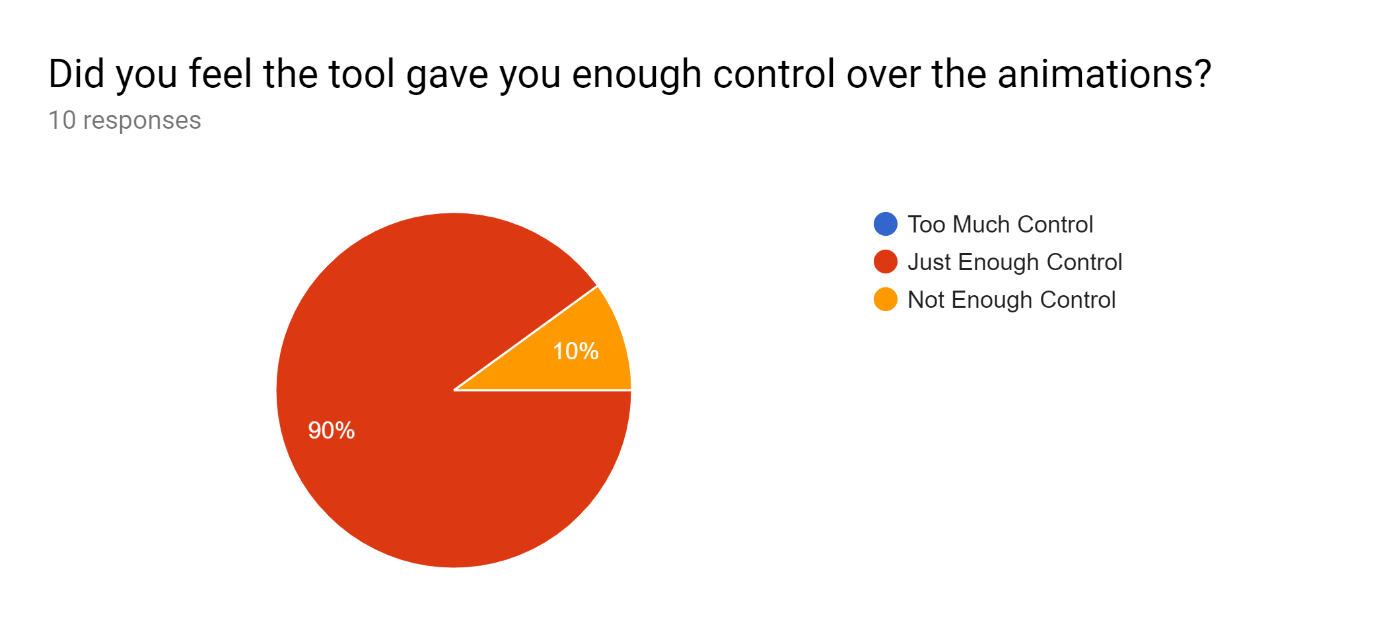
Did you feel
the tool gave you enough control over the
animations?
Figure 37 shows that
90 of users had
felt they had enough control over the animation when using the tool.
This is encouraging as it shows the system had just enough controls not
to overwhelm the user yet still giving the option to control a vast
majority of the animation.
[fig:7_animation_controls]
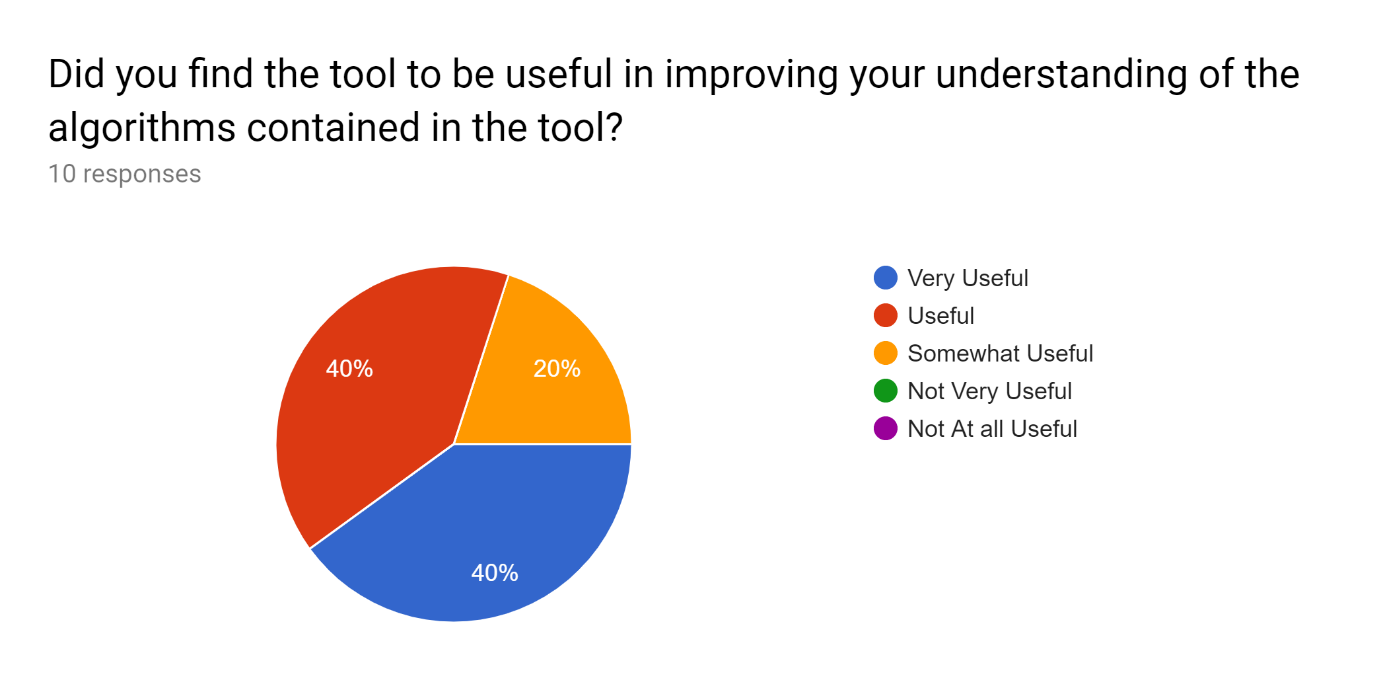
Did you find
the tool to be useful in improving your understanding of the algorithms
contained in the tool?
Overall, from figure 38 we can see
100 of the
users found the tool to be at least useful or better in helping them
improve their understanding of the algorithms. This is an extremely
encouraging result as it proves this tool can be helpful. With further
enhancements, the tool could be more helpful for others.
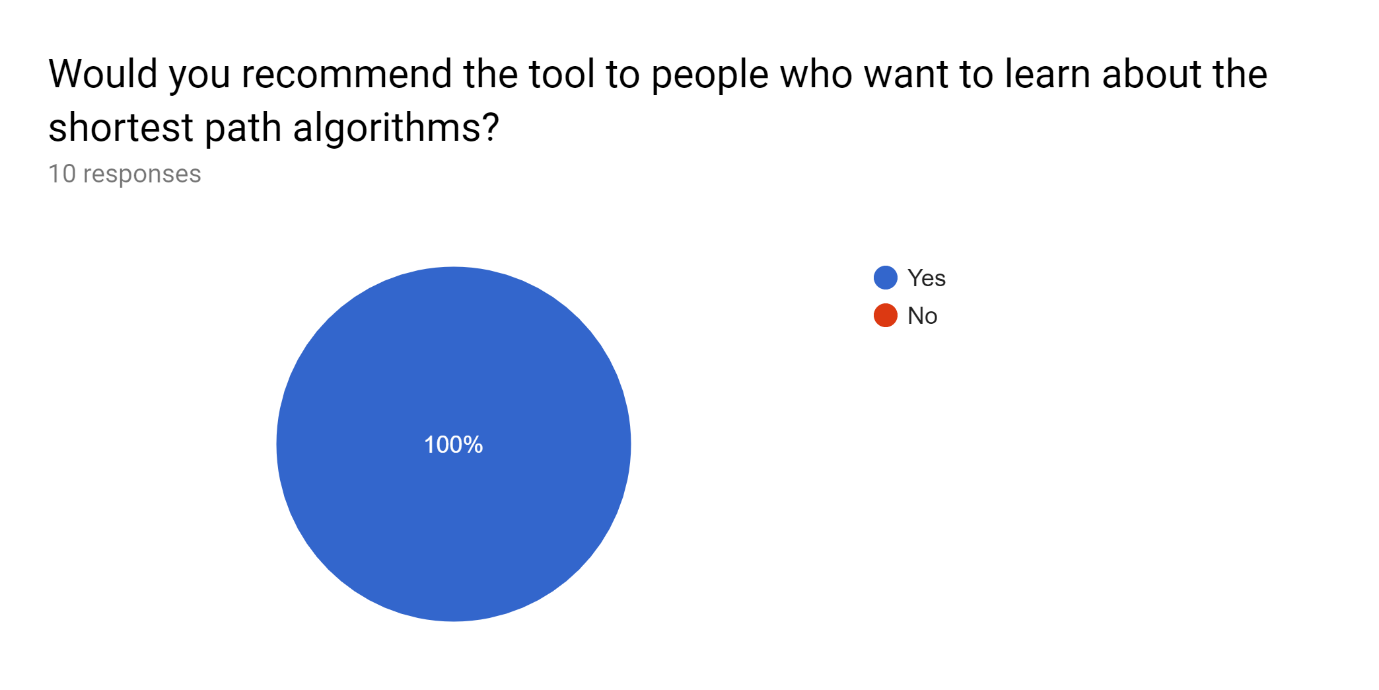
Would you
recommend the tool to people who want to learn about the shortest path
algorithms?
The result of this question looked most promising as
100 of users
said they would recommend the tool for anyone who wants to learn about
the shortest path algorithms. This very encouraging to see as it
demonstrates a successful project.
A part of the system evaluation is based on the results given back from the users. The feedback and results were collected using a questionnaire. This was by far the easiest way to collect feedback with the time constraints on this project as the alternative would be to interview one on one with each user.
The users were asked what they most enjoyed and least enjoyed about the
app as well as suggesting a way to improve the app. From the response,
the users enjoyed most of the features of the app; however, the
consensus was that the app did not perform well on mobile platforms.
More than 50 of
the users did not enjoy the experience on mobile a platform. This was
inevitable since the app was designed for desktop and mobile was more of
an afterthought during the designing phase. In retrospect, the mobile
platform should have been the primary platform to target since almost
everyone owns a mobile device in the modern era.
The quality of the suggestion of improvements was also particularly insightful to see where the applications fell short. One response of creating more interactive questions by using the graph itself would have been a useful addition to the tutorials. This could potentially be something that can be added to the application in the future. In addition, most users suggested improving the responsiveness of the application on mobile sites as well as adding a level of difficulty to the tutorials. All the answers can be seen in Appendix G.
This is the final chapter of this project and concludes what has been undertaken in this project. We will go through each of the objectives we initially set ourselves to see if we have met them. Next, we will beefily outline any future work that will benefit this project. Finally, we will give a summary of the whole project.
Objective 1: Perform an investigation into graph algorithms to identify which subset of algorithms should be included in the application.
During the background research, the shortest path problem was identified as the focal point of the application; along with the three algorithms: Dijkstra, Bellman-Fords and Floyd Warshall. We defined all three algorithms using pseudo code and successfully incorporated it into the tool. This objective was successfully met.
Objective 2: Analyse and create a design solution that appeals to the end user, while ensuring usability is still high.
During the background research, the important HCI principles were identified that was used in the designing phase to ensure high usability. We followed the layout designs that are used by mainstream applications to ensure the application was appealing to the end user, by taking advantage of the familiarity principle described HCI. Furthermore, from the feedback received by the users (figure 35), we can successfully conclude that the users found the application to be very usable and therefore achieving our second objective.
Objective 3: Animate the chosen algorithms.
We identified two methods of animation during the background research; Dynamic program visualisation and state-driven animation. In the implementation of the animations, we used concepts from both techniques. We captured the state of the algorithm during the run time and displayed it to the user using primitive shapes and colours. Regarding the animation definition, it is fair to say we have successfully animated all three algorithms. In addition, during the testing phase, the requirement R03 is passed thus meeting this objective.
Objective 4: Create a subsystem to allow automatic marking after completing tutorials contained on the site.
Two of the requirements (R08 and R09) described in the design section were specifically included to help realise this objective. The system allows three types of questions that are currently in use. This is adequate for this project; however; it may be beneficial to add more types in the future. During the testing phase the requirements R08 and R09 passed therefore ensuring the objective was met.
Objective 5*: Evaluate the app, using the user’s testing scores and questionnaires as a focal point of analysis to conclude if the app has allowed the user to gain a deeper understanding of the algorithms.*
The final objective is to perform analysis to conclude if the tool was helpful for the end users. The results were very positive in that a vast majority of the users surveyed said their understanding of the Dijkstra algorithm had improved after using the tool. Although no data was collected for the other two algorithms, it would be a fair assumption to extrapolate the data and apply them to both Bellman-Ford and Floyd-Warshall since they use the same techniques as Dijkstra algorithm.
The data collected from the survey was enough to perform an analysis to conclude that the tool did help the users gain a deeper understating thus allowing this objective to be attained.
A set of objectives and an aim was initially set for the project to solve the problem domain of this project; to develop a tool to aid in the learning of graph tool.
Starting of the project, research was conducted to help identify the problem set and algorithms that were used throughout this project. We then looked further into each algorithm, defining the pseudo code as well as performing a brief analysis of each algorithm. In addition, we also defined the graph data structure as well as briefly look at different animation techniques. The research undertaken at this stage significantly helped the design phase. Next, we compared different technologies that were available to us based on features and usability to decide which technology stack should be chosen. In the end, we concluded to use Python3 in combination with Django framework as well as vis.js as the graph network visualiser. The final topic we researched was HCI since this was an essential part of the usability objective. During the research, we identified fundamental principles that were used when designing the user interface.
After researching, the high-level design of the system was created. The design was to process all the data on the server and then show the output on the client using an API. The basic idea involved the user sending the graph data to the server, where animation ‘frames’ were produced, which was then used to animate the graph on the client. In addition to this, we also designed the quiz engine that was used to test the user’s knowledge. The quiz engine uses the data collected from the animation engine to generated questions that are presented to the users.
We then used the designs to implement the project to bring it to life. Personally, many skills were learned throughout the development, mainly soft skills such as project management and agile methodologies. Some mistakes were made by underestimating the time required to develop some tasks but, in the end, all requirements were implemented with all tests passing but one. Furthermore, testing uncovered some implementation flaws such as the mapping class that can be improved as future work.
Finally, we evaluated the system by surveying users to get feedback and opinions. We gained significant insight into the system and figured out what the users liked and what the thought needed improving.
In conclusion, the original goal of the project to create a tool that will aid in the learning of graph algorithms using visualisation and questions has been met. From figure 34 we can see there is a significant improvement in understanding for most users before and after using the tool. However, these results are self-evaluated by the user, so there are no quantitative results to back up the claims as not enough user data was generated by the users during the short time frame of this project. Nevertheless, the data gathered from the users suggest this project was successful.
The testing phase and user feedback revealed that the application did not perform very well mobile platforms. Optimising it on mobile would be hugely beneficial as it is the primary platform for most users who use the application. Furthermore, this can be taken a step further by converting the application into a progressive web app. In doing this, the application can be used both offline and online further making the tool available for more users.
Adding a level of difficulty to the tutorial could be a useful feature
that will help the users stay engaged in the app. As the user completes
more tutorials, the question should also increase in difficulty; this
should keep the users more engaged. Consequently, this will directly
address one of the user’s feedback of
the tutorials
are too repetitive
.
One of the feedbacks received was to incorporate the tutorials to be more interactive. The user suggested using the graph as the medium to answer the questions instead of the traditional form input. An example of this would be to ask the user to select all the nodes in order of the iteration. This can also be easily be incorporated with the level of difficulty as different question types can be categorised. To build on this, the user also suggested implementing tutorials that ask the user to build a graph network given an output. This would be an extremely efficient way to test the understanding of the user as it requires the knowledge of exactly how the algorithms work.
Adding the ability to load and save graphs will add an element of social capabilities to the tool. The ability to download, load and share the graphs amongst the users will have the added benefit of them sharing graphs they had problems understanding. This should encourage combined studying which should help in the learning experience.
As described in the implementation section of the algorithms, it is difficult to maintain the mapping of the pseudo code. It was suggested that a different approach should be taken to allow better testing and error detection when mapping the algorithms. Instead of mapping the line number to the python code, we should map the pseudo code itself to the python code. Then a simple error detection can be implemented to check if all line of pseudo code is mapped. Furthermore, this will also allow error detection when the text pseudo code file is updated, whereas the current system will not.
-
Anderson, J., McRee, J., Wilson, R.
Team, T.E. (2010) Effective UI: The Art of Building Great User Experience in Software. O’Reilly Media, Inc.
-
Bacon, J. (1994) Introduction to LAMP technology: Explore the open source Web development platform. 19.
-
Bondy, J.A.
-
Byrne, M.D., Catrambone, R.
-
Chodorow, K. (2013) MongoDB: The Definitive Guide. 2nd ed. Beijing: O’Reilly.
-
Cormen, T.H. (ed.) (2009) Introduction to algorithms. 3rd ed. Cambridge, Mass: MIT Press.
-
Diehl, S. (2005) ’Software visualization’, in 27th International Conference on Software Engineering (ICSE 2005). [Online]. 2005 p.
-
Dix, A. (ed.) (2004) Human-computer interaction. 3rd ed. Harlow, England ; New York: Pearson/Prentice-Hall.
-
Flanagan, D. (2006) Google-Books-ID: k0CbAgAAQBAJ. JavaScript: The Definitive Guide. O’Reilly Media, Inc.
-
Ganguly, S. (2018) Applications of Graph Data Structure. GeeksforGeeks
-
Gouy, I. (2019) Computer Language Benchmarks Game. [Online] [online]. Available from: https://benchmarksgame-team.pages.debian.net/benchmarksgame/faster/node-python3.html (Accessed 2 May 2019).
-
Grinberg, M. (2014) Flask web development. First edition. Sebastopol, CA: O’Reilly.
-
Haviv, A.Q. (2014) MEAN web development. Packt open source - Community experience destilled. Birmingham: Packt Publ.
-
Holovaty, A.
-
Kerren, A.
-
Kim, B. (2015) Gamification in Education and Libraries. Library Technology Reports; Chicago. 51 (2), 20–03.
-
Kim, Y.H., Kim, D.J.
-
Kitchenham, B.A.
-
Lei, K., Ma, Y.
-
Niemeyer, P.
-
Pérez, L. (2013) Heroku: Up and Running.
-
SimlarTech (2019) PHP VS Spring - Framework Technologies Market Share Comparison. [Online] [online]. Available from: https://www.similartech.com/compare/php-vs-spring (Accessed 14 April 2019).
-
Turner, J. (2014) Announcing TypeScript 1.0. [Online] [online]. Available from: https://devblogs.microsoft.com/typescript/announcing-typescript-1-0/ (Accessed 12 April 2019).
-
Walker-Morgan, D. (2011) The Node.js creation story. [Online] [online]. Available from: http://www.h-online.com/open/features/The-H-Speed-Guide-to-Node-js-1363974.html 3Fpage=2 (Accessed 12 April 2019).
-
Walls, C. (2011) Spring in action. 3rd ed. Shelter Island: Manning.
Algorithm: Dijkstra
Inputs: Graph(V,E), Source
Variables: distance: list where the index represents the node
previous: list where the index represents the node
Return: list of distances
list of
previous
Begin
for each vertex v in Graph do:
distance[v] = infinity
previous[v] = undefined
done
distance[source] = 0
Q = the set of all nodes in Graph
while Q is not empty do:
u = node in Q with smallest distance
remove u from Q
for each neighbour v of u do:
alternative = distance[u] + distanceBetween(u,v)
if alternative < distance[v]:
distance[v] = alternative
previous[v] = u
fi
done
done
return distance[] previous[]
End
Algorithm: Bellman-Ford
Inputs: Graph(V,E), Source
Variables: distance: list where the index represents the node
previous: list where the index represents the node
Return: list of distances
list of
previous
**Begin **
for each vertex v in Graph do:
distance[v] = infinity
previous[v] = undefined
done
distance[source] = 0
for i from 0 to sizeof(V) - 1:
for each edge(u,v) of E do:
alternative = distance[u] + distanceBetween(u,v)
** if alternative < distance[v]:**
distance[v] = alternative
previous[v] = u
fi
done
done
** for each edge(u,v) of E do:**
alternative = distance[u] + distanceBetween(u,v)
if alternative < distance[v]:
error Graph Contains Negative-weight
Cycle
fi
done
** return distance[] previous[]**
End
Algorithm: Floyd-Warshall
Inputs: Graph(V,E)
Variables: distance: 2d array with the shortest path for all
pairs
Return: distance as a 2d array
**Begin **
0.3in0.0in
Let distance be sizeof(V)
sizeof(V)
array initialized to infinity
for each edge(u,v) of E do:
** distance[u][v] = distanceBetween(u,v)**
done
for each vertex v of V do:
** distance[v][v] = 0**
done
for i from 0 to sizeof(V) do:
for j from 0 to sizeof(V) do:
for k from 0 to sizeof(V) do:
if
distance[j][k] > distance[j][i] + distance[i][k]:
distance[j][k] = distance[j][i] + distance[i][k]
fi
done
done
done
** return distance[][]**
end
This will define all the data structures that will be used throughout the API and the application.
The node object is used throughout the system and the API to represent a node in a graph network. The structure of the node is similar to that of vis.js node object, in that the structure used in this project uses a striped version of the node structure that vis.js uses. This allows both server and client to use the same structure between them, keeping the data consistent.
Nodes =
id: string,
label: string
color: string
Similar to the Node, the Edge data structure is a stripped-down version of the edge structure used in the vis.js framework.
Edge =
id: string,
label: string,
from: string,
to: string,
ditance: int,
color: color:
string
,
The UpdateData object is used for the animation phase of the application and holds the data for each frame.
UpdateData =
classID: string,
rawData: string,
inlineExp: string,
isShownOnScreen: boolean
The TableData object is used to represent the updates required in a frame. The table data is similar to UpdateData and will most likely hold the same values. However, keeping them as separate objects allows them to be updated individually and without affecting the other; this may be desirable in certain situations.
TableData =
classId: string,
tableExp: string,
rawData: string
The ExtraData object is used by the server to group up both the TableData and UpdateData. Even though the UpdateData object contains rawData that can be used to display in the table, we need a separate table data field since table data may require more formatting or different data when displayed to the user.
ExtraData =
tableData: list
updateData: list
The Frames object is what is used to group up all necessary data to display a single frame to the user. All the data contained in this object is predefined above.
Frames =
mapping: int,
explnation: string,
data: ExtraData,
edges: list,
nodes: list
The animation frame is what gets generated at the server. This is the object that will be passed to the client to process and display the animations to the end user.
Screenshots to show graph manipulation
Three snapshots of the algorthim animation in progress are shown below
Dijkstra
Bellman-Ford
Floyd-Warshall
The graph from F3.3 but manipulated to add the edge from 4 to 1 with distance of 12.
Screen shot of summary page with quiz id (260). Also includes screen shot of document from data base with the same quiz id and the scores.
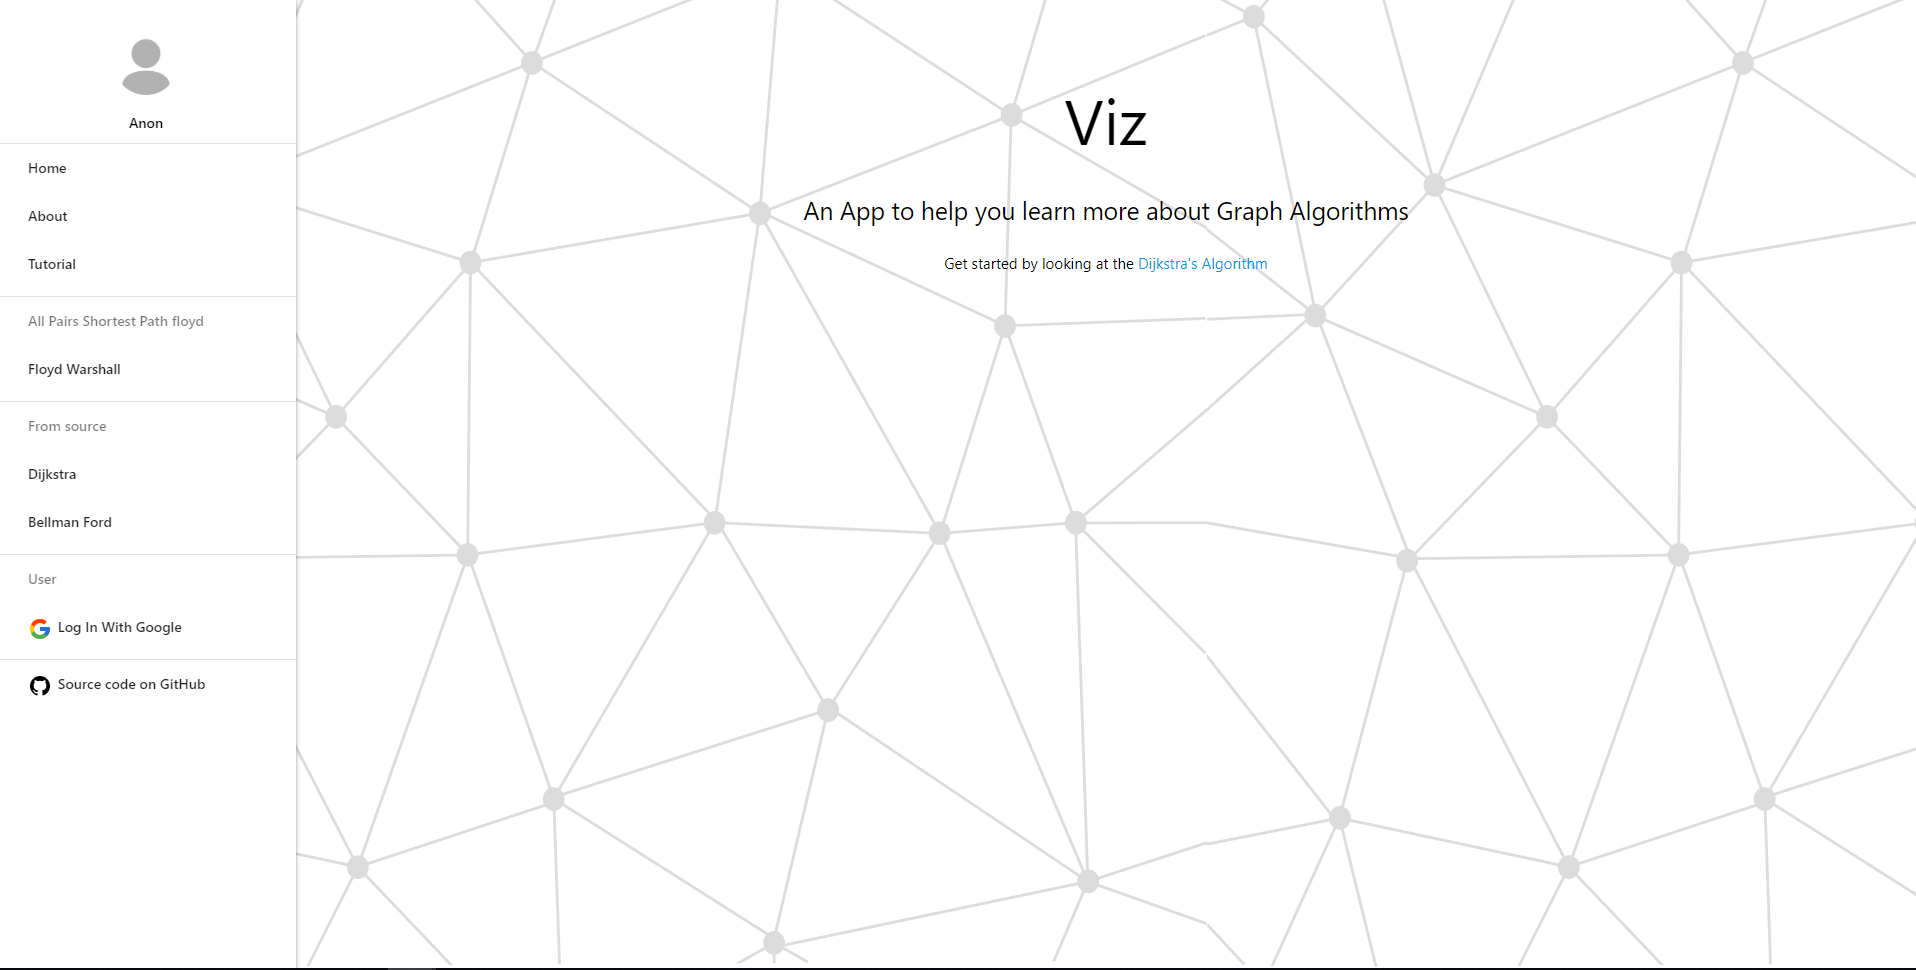
[fig:ogle_Sign_in_option_]
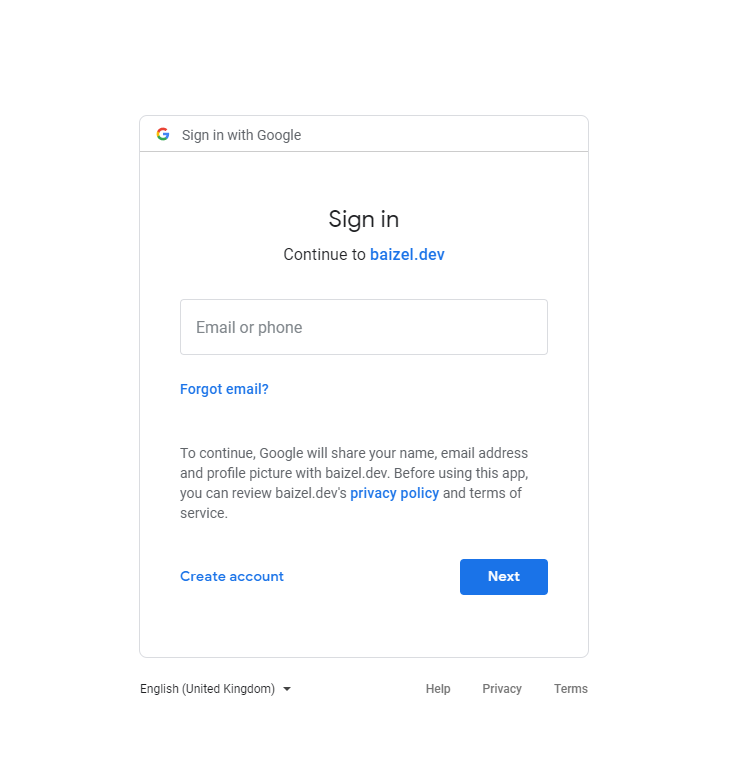
[fig:ogle_Sign_in_prompt_]
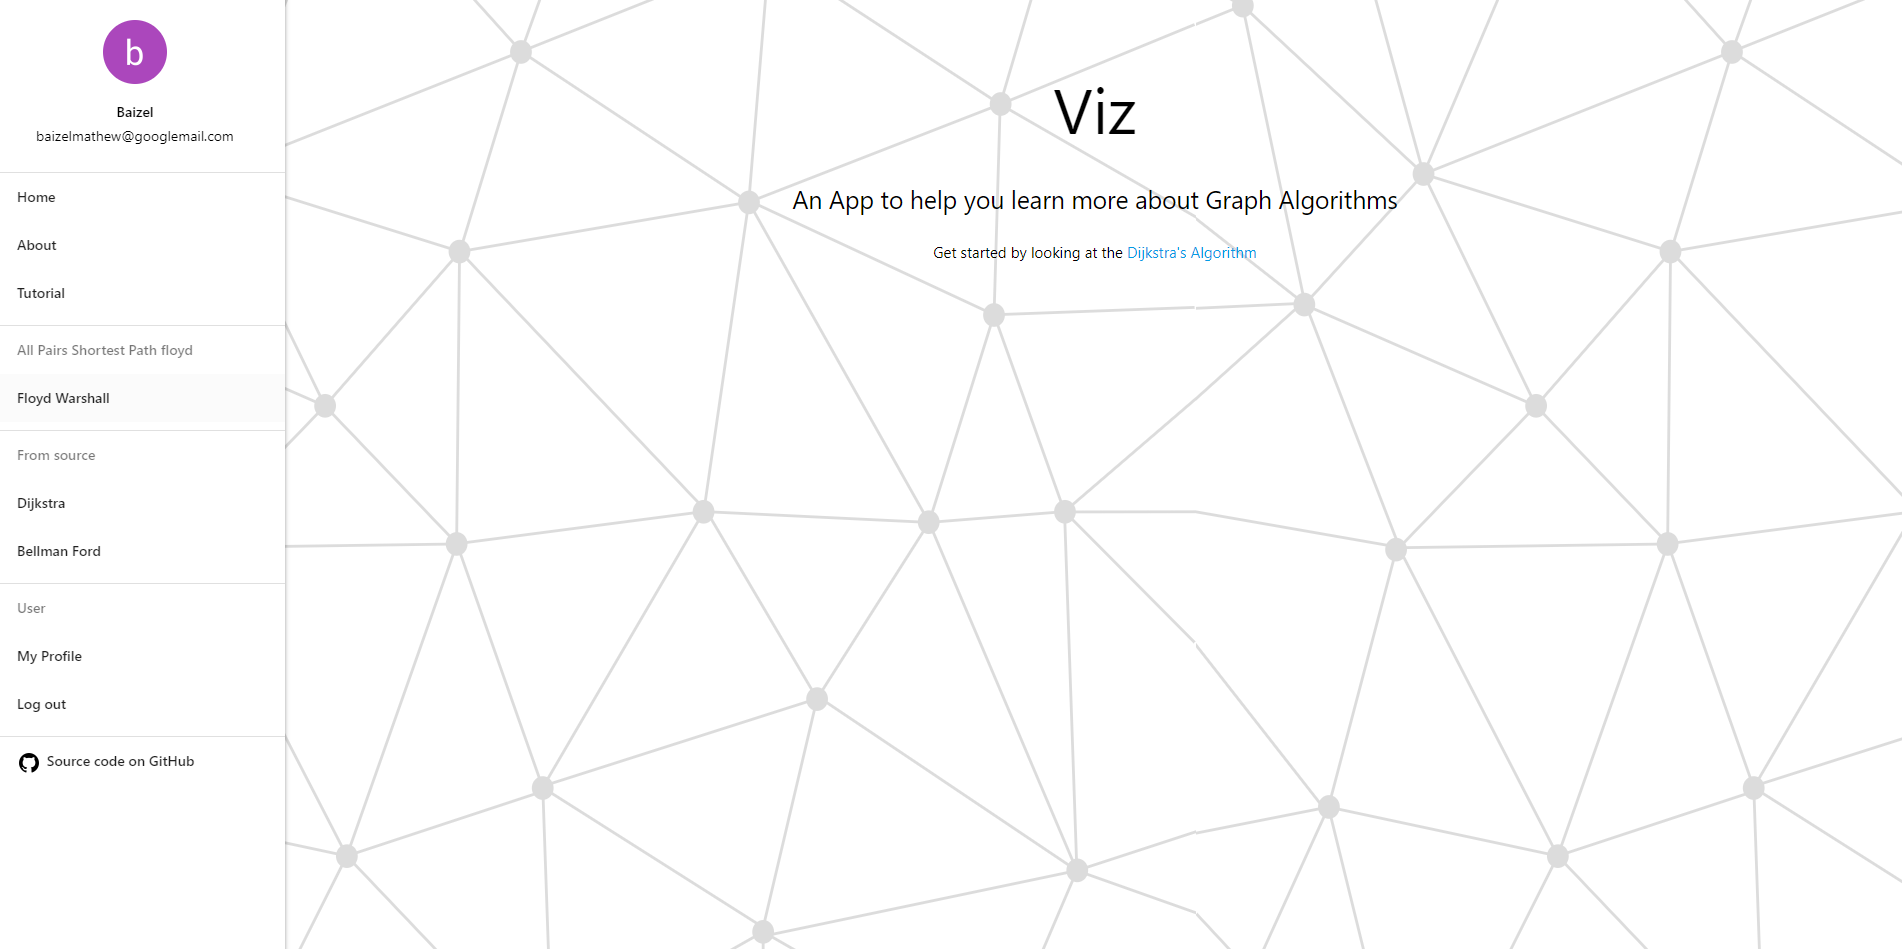
[fig:ccessful_Google_Sign_in_]
Graph only loaded partially for summary and no scrolling available when graph displayed.