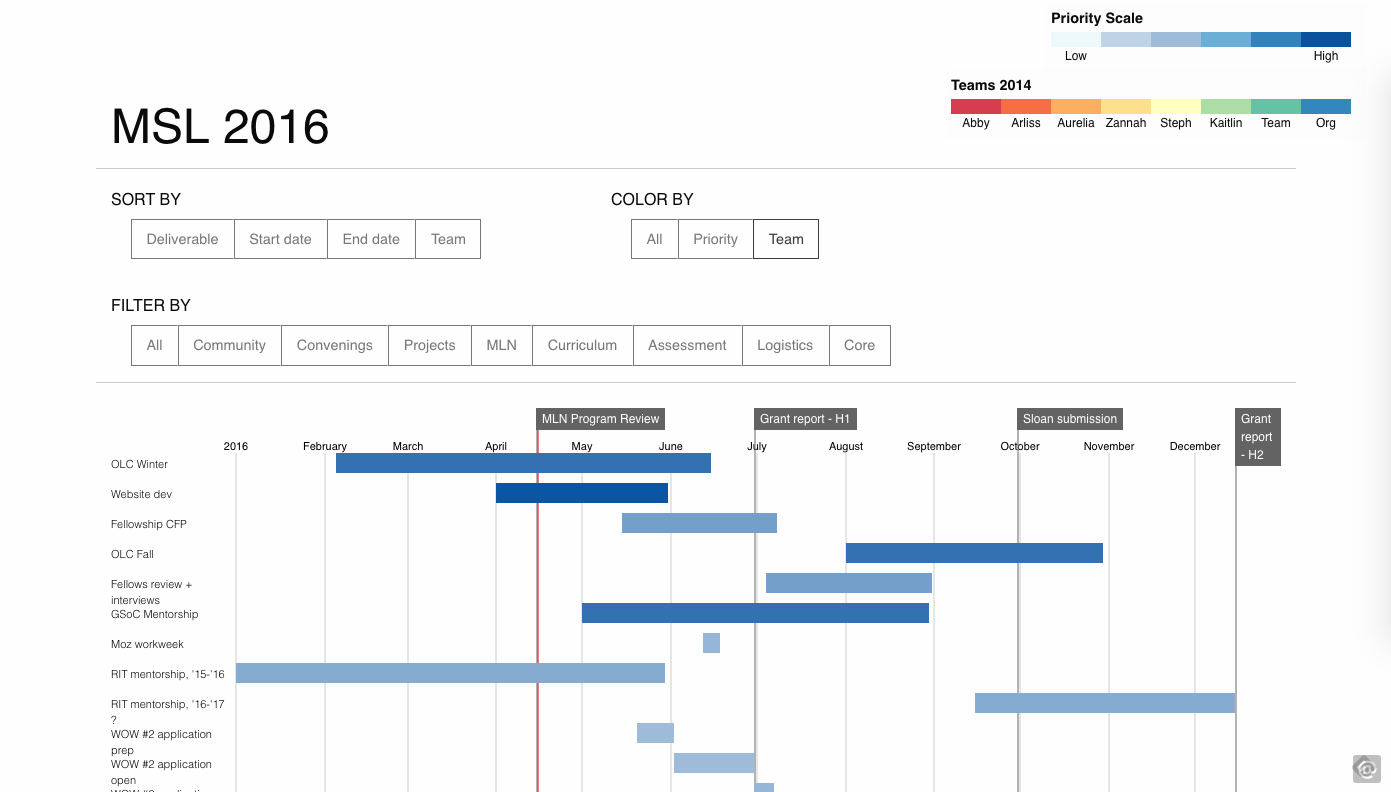
This is a simple sortable chart for viewing projects and tracking them on a timeline.
Data CSV is stored in Google Drive and looks like this:
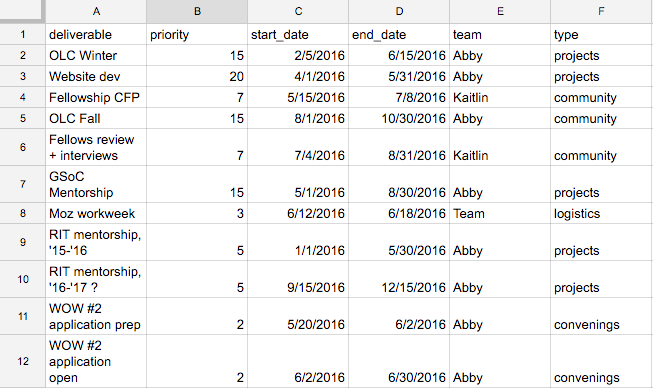
Headers are static, but all values are editable in the data.csv file.
| deliverable | priority | start_date | end_date | team | type |
|---|---|---|---|---|---|
| project1 | value1 | date1 | date2 | [Abby/Aurelia/...] | community |
| project2 | value2 | date1 | date2 | [Abby/Aurelia/...] | logistics |
- deliverable is project name
- priority is an arbitrary weight (maybe priority of a project, maybe hours of investment, maybe resources used), in this case, it's roughly the number of hours a project will take [1]
- dates are the start and end date of a project
- team is the name of the team responsible for the deliverable
- type is one of several categories for filtering purposes (community, logistics, assessment, convenings, trainings...)[2]
[1]: We can decide what numerical value to prioritize by, I just wanted to log this as a sortable placeholder for future values we might want to track.
[2]: Milestones are vertical plum lines on the chart. You can draw a plum line, as opposed to a bar, by entering a deliverable name, start_date and type of project as "milestone"). Check the csv for examples of this.