
This picture is a work by Emmanuel Douzery
- Small circular DNA made up of 16,569 base pairs
- Multiple copies within the mitochondrion organelles of the cell
- Contains 37 genes
- 2 rRNAs
- 22 tRNAs
- 13 Proteins
- Encoded proteins are involved in oxidative phosphorylation process, generating energy through ATP production
- Economically packed with overlapping genes and a very minimal non-coding region
- Maternally inherited
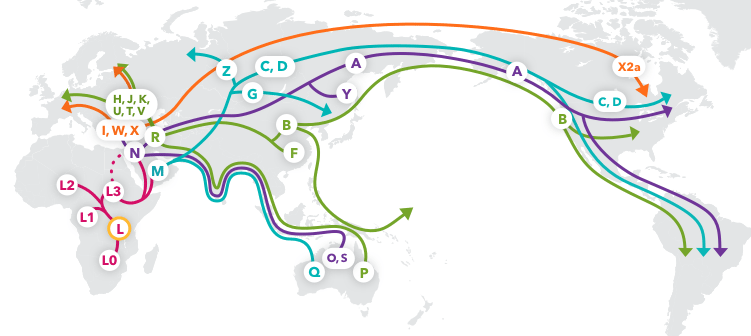
This image is of mtDNA Haplogroup Migration Map from 23andMeBlog
- Mitochondrial Eve lived around 200,000 years ago and is considered to be living humans' most recent matralinial common ancestor
- Originating in Southeast Africa
- The accumulation of mutations in our mtDNA allow for the traceback of our lineage
- Single Nucleotide Polymorphisms (SNPs) can be detected ar specific locations in the mitochondrial genome which can be grouped and assigned to global populations
- The highly polymorphic, non-coding control region in the D-loop of the mtDNA is also known as the hypervariable region and is best for determining mtDNA lineage
- Haplogroup nomenclature began in North America with A, B, C, and D and branched out through all the letters of the alphabet
- The native North American haplogroups are branched out from Asia due to early migration
- NSCLC accounts for 80%-85% of lung cancers
- Lung Adenocarcinoma (LUAD) is the most common malignancy
- Heavily related to tobacco smoking but also the most frequent lung cancer found in “never-smokers”
- Tobacco carcinogenesis is believed to play a role in the vulnerable mtDNA through alterations by way of somatic mutations
- Assign mitochondrial DNA to haplogroups
- Perform and compare global differential gene expression analysis across haplogroups
- Examine overall impact haplogroups may have on NSCLC LUAD outcome, stage, and metabolism
- Obtain controlled access data from the GDC Data Portal
- Load data into cluster environment for read depth analysis
- Generate file formats: MPG, VCF, FASTA, and HSD
- Call probable haplogroups
- Integrate haplogroups with participant clinical data
- Perform RNA-seq analysis with high dimensional data visualization
- Obtained whole exome, aligned, paired-end sequenced reads from GDC Data Portal
- TCGA - The Cancer Genome Atlas
- CPTAC - Clinical Proteomic Tumor Analysis Consortium
- Loaded data to HPC with GDC data trasnfer command
module load anaconda/2
gdc-client download -t <token> -m <manifest>
-
Goal to analyze TCGA and CPTAC samples with read depth scripts to see which to use for full study
-
Wrote a shell pipe to loop through each BAM to get number of mitochondrial DNA mapped reads per sample with Samtools
- Mitochondrial region may be denoted 'chrM' or 'MT', needs to be checked
-
Helps assess overall quality of samples
for i in samples/*/*.bam
do
    samtools idxstats ${i} > stats/$(basename ${i} .bam)_idx.bam
done
grep -H 'chrM' stats/*.bam > stats/chrM_bamstat_summary.txt
Samtools version 1.9
- Next observed per-base read depth with PileUpStats.py script
- Counts number of bases with read depths greater than 5 and 10
- Returns summary file with fraction of bases with read depths of 5 or 10 or greater, and mean, median, and minimum read depths per sample
- Outputs overall stats for all samples read
- The greater the read depth, the more confidence and accuracy in base calls
- Important for calling variants and when ensuring the correct haplogroup is called
Python version 3.7.2 Pysam version 0.16.0.1 Numpy version 1.21.1
-
Use Integrative Genomics Viewer (IGV) to visually check selected TCGA and CPTAC samples to match calculations with observations
-
Overall, the initial data analysis showed that the CPTAC study mitochondrial reads had a much greater coverage and read depth and would be better to utilize for this study
- Original CPTAC folders and files are a string of ~50 random chracters which my prove to be troublesome in downstream analysis
- A sample sheet is supplementary material that was downloaded with the sample files
- It can work as a name map to map back the long character string to a shorter Case ID name
- I developed the python scripts "RenamerByMap.py" and "RenamerByMapCounts.py"
- These map the long name back to the Case ID and append the first letter of the sample type to the end
- Sample could be of Tumor, Normal Tissue, or Blood origin
- The first script is used for renaming the BAM files and their folders
- The second is used for the count files when preparing to perform DGE analysis
- These map the long name back to the Case ID and append the first letter of the sample type to the end
Python Version 3.9.5 Pandas Version 1.2.4
- Used Bash/Perl Script from Dr. Jamie Teer to obtain an HSD file from the BAM files
- This file contained the SampleID, Range, Haplogroup (column blank), and polymorphisms
- This file is the input to the Haplogrep2 tool which calls the most probable haplogroup based on samples polymorphisms
- These polymorphisms were additionally observed in IGV to visualize variations in the genome
Haplogrep version 2.2
-
I then developed a Python script to parse through the clinical data in JSON format and extract information
- Race, Ethnicity, Vital Status, Smoker Status
-
The script output a TSV data array with the Case ID and the specified clinical information Python version 3.9.5 Numpy version 1.21.1
-
I obtained additinal clinical data from CPTAC-3 study site
- This contained many other parameters and helps clear up smoking status and ethnicity variables
- Imported data into R
- HSD File in TSV format
- CPTAC-3 Clinical data
- From JSON in TSV format
- From site in CSV format
- HT-seq primary tumor count data from GDC data portal
- The first letter of each haplorgoup was subset and assigned to a new column, 'HaploID'
- The data was clean and merged into a single data frame
- Sample data distributions were visualized
- Followed RNA-seq protocol utilizing edgeR, limma, and Glimma
- Paper from Law, C. et al.
- With Asian and European haplogroups being most heavily represented they were chosen as the main comparison factor
- Specifically, HaploIDs B vs H and M vs R were compaired
- No significantly differentially expressed genes were found
- Further documentation and visualization for this workthrough can be found in the 'markdowns' and 'Rscripts' folders
- Including package version information
- Add in normal tissue sample information from CPTAC study
- Was not observed here due to uneven amount of samples
- Look into TCGA study through RNA-seq analysis
- Greater number of samples, although mtDNA read depth is not as great
- Study gene expression in "never-smokers" to see possible effect of carcinogenesis