
synloc is an algorithm to sequentially and locally estimate distributions to create synthetic versions of a tabular data. The proposed methodology can be combined with parametric and nonparametric distributions.
synloc can be installed through PyPI:
pip install synloc
Assume that we have a sample with three variables with the following distributions:
The distribution can be generated by tools module in synloc:
from synloc.tools import sample_trivariate_xyz
data = sample_trivariate_xyz() # Generates a sample with size 1000 by default.
Initializing the resampler:
from synloc import LocalCov
resampler = LocalCov(data = data, K = 30)
Subsample size is defined as K=30. Now, we locally estimate the multivariate normal distribution and from each estimated distributions we draw "synthetic values."
syn_data = resampler.fit() 100%|██████████| 1000/1000 [00:01<00:00, 687.53it/s]
syn_data is a pandas.DataFrame where all variables are synthesized. Comparing the original sample using a 3-D Scatter:
resampler.comparePlots(['x','y','z'])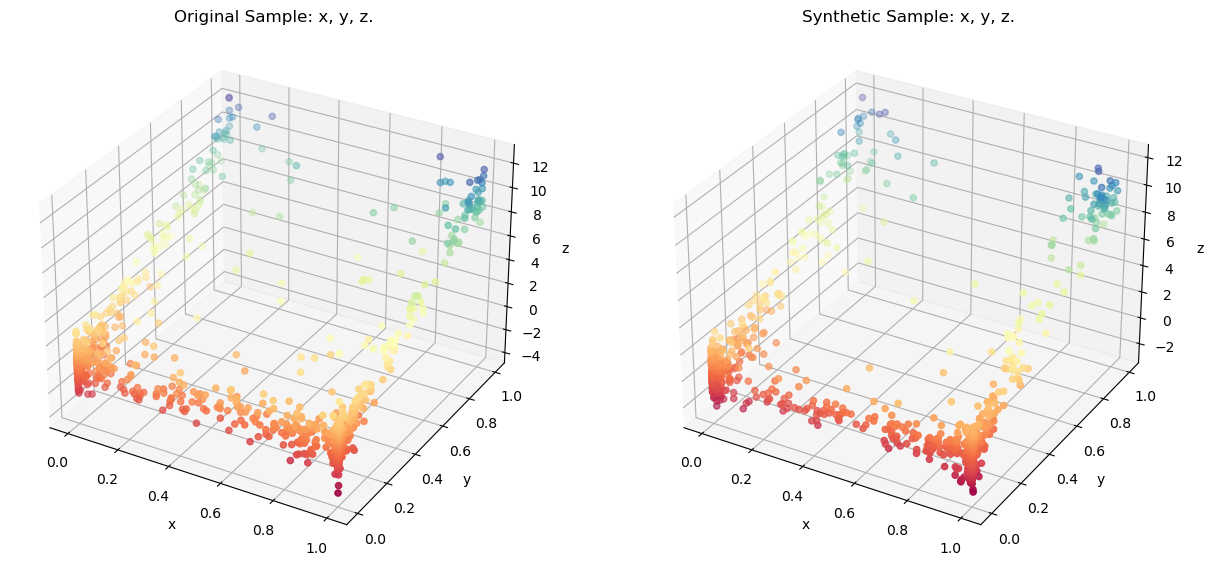
If you use synloc in your research, please cite the following paper:
@article{kalay2022generating,
  title={Generating Synthetic Data with The Nearest Neighbors Algorithm},
  author={Kalay, Ali Furkan},
  journal={arXiv preprint arXiv:2210.00884},
  year={2022}
}