- Load values from csv file (in this case files are stored in well known folder)
- Start the script that search for all local minimum and maximum of the graph
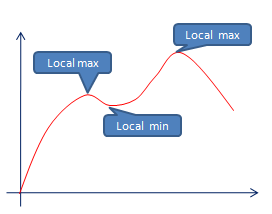
- Plotting of the results with dot marks of what is considered as minimum and maximum
This script was used and tested in practice when I had to read stress and strain diagrams of the screwing process and to find the yield strength and basically derivate it from the data graphs. Speaking in words of math, this is nothing but the approximation of finding local extremus of the function.