The wine industry is considered to be a significant business sector and wine tasting has been a popular trend since the ancient times for the evaluation and examination of wine. The quality of wine depends on the type and proportion of the ingredients of wine. Hence it is useful for the wine industry to design inexpensive automated tools to predict the quality of wine. In this project I will be using the Wine Quality Data Set which contains about 5000 instances of white wine with 11 attributes based on physicochemical tests. I will be examining these attributes and their relationship to the quality of wine. Based on the relationship of the attributes I will be developing a ML model which can be used to evaluate and predict of the quality of wine instances. So the goal of this project is to design a data mining technique as an additional support to the wine tasting to help improve the production of wine.
Understanding and visualizing the data is a key factor to discover patterns in the data. Hence I created visualizations to understand the target variable, the attributes and the relationship between them. The following was discovered in the EDA process:
- The dataset has no null values.
- All the attributes are numerical.
- There are about 937 duplicate records.
- The 'quality' of wine ranges from 3 to 9.
- A few instances of outliers were found using the 1.5(IQR) rule.
Let us take a look at the target variable "Quality"
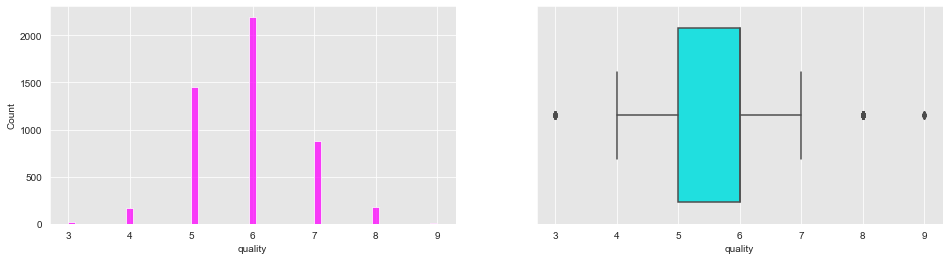
From the above plot we can see that most of the wine are in the quality range of 4 to 7. More than 2000 instances of the wine are having a quality of 6.
Further we will look at the attributes and their relation to the target variable "quality".
fixed_acidity, residual_sugar, free_sulfur_dioxide and sulphates
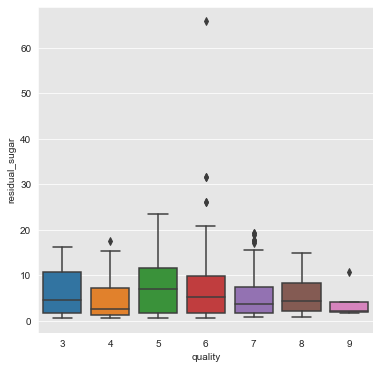
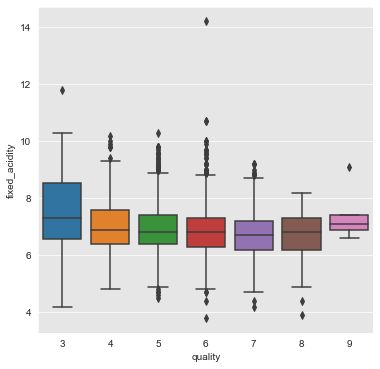
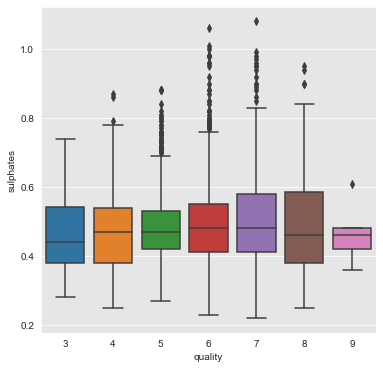
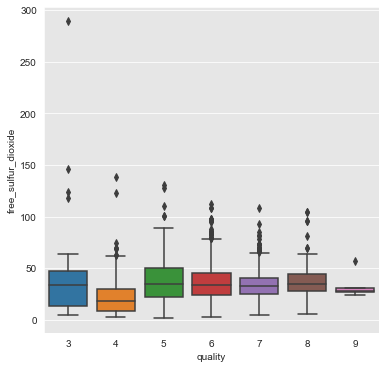
From the above plots we can infer that the attributes fixed_acidity, residual_sugar, free_sulfur_dioxide and sulphates have a weak association with quality of wine.
volatile_acidity
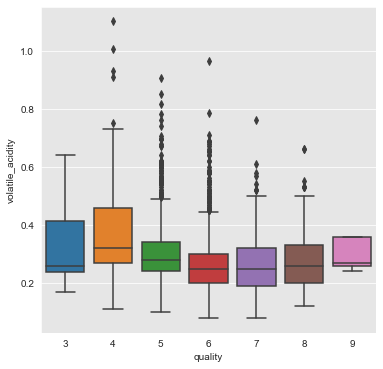
From the above plot we can infer that the attribute volatile_acidity has somewhat positive association with quality of wine.
citric_acid, pH and alcohol
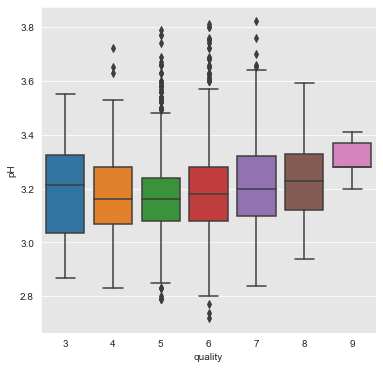
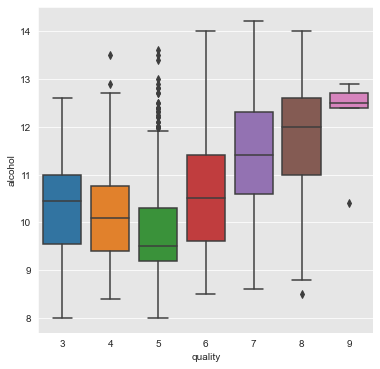
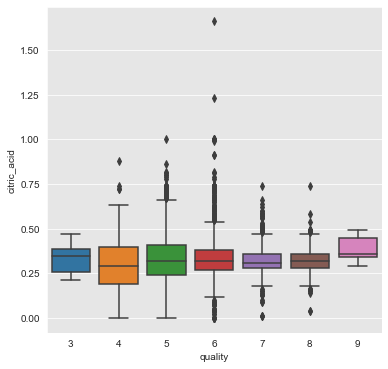
From the above plots we can infer that the attributes citric_acid, pH and alcohol have a positive association with quality of wine.
chlorides, total_sulfur_dioxide and density
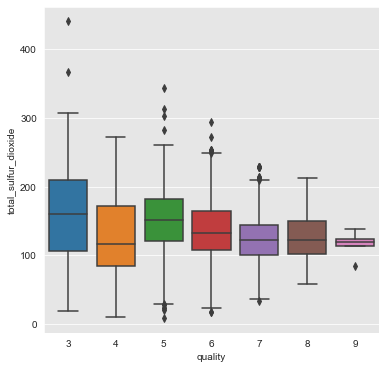
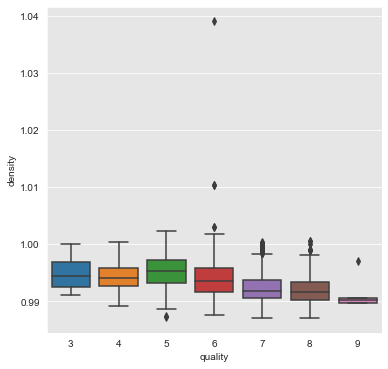
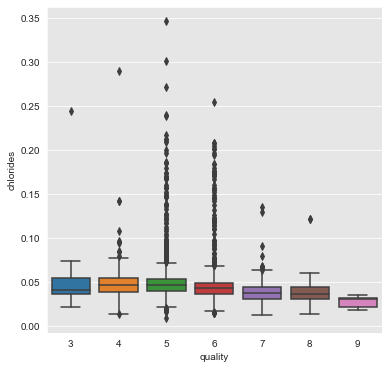
From the above plots we can infer that the attributes chlorides, total_sulfur_dioxide and density have a negative association with quality of wine.
All these associations can also be seen in the correlation matrix below:
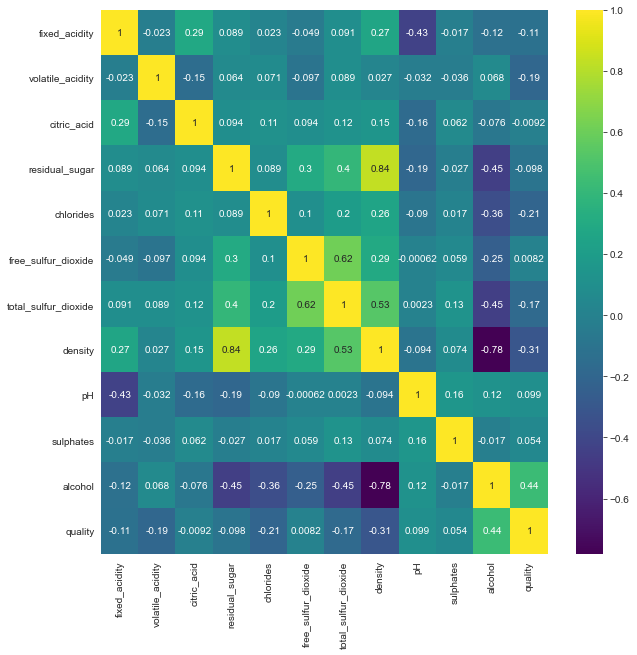
From the correlation values we can infer that:
- The variable alcohol has moderate positive correlation to the wine quality.
- The variable density has moderate negative correlation to the wine quality.
- There is a high positive correletion between density and residual sugar.
- Total sulphur dioxide and free sulphur dioxide have a positive correlation.
Now that we have gained the understanding about the attributes and the target variable through the EDA, we can move ahead and try various Machine Learning Algorithms to design a system to predict the quality of wine.
For the data cleaning and preprocessing I examined and implemented the following steps:
- The duplicate records were removed.
- The outliers were removed.
- The dataset attributes were standardized.
- The target variable was encoded.
I have tried various classifiers and logistic regression on this dataset. I have evaluated the performance of these models based on the predictions made by each model with the F1 score. To understand if the results of our experiments are valid and to ensure a fair comparison for all the models I have used k-fold Cross Validation strategy.
The models tested are:
| Model Name | Avg. F1 Score |
|---|---|
| SVC | 0.788345 |
| Random Forest Classifier | 0.812210 |
| Decision Tree | 0.775633 |
| KNN Classifier | 0.813694 |
| AdaBoost Classifier | 0.799841 |
| Logistic Regression | 0.793923 |
Let us take a look at the visualization to better understand the performance of each model.
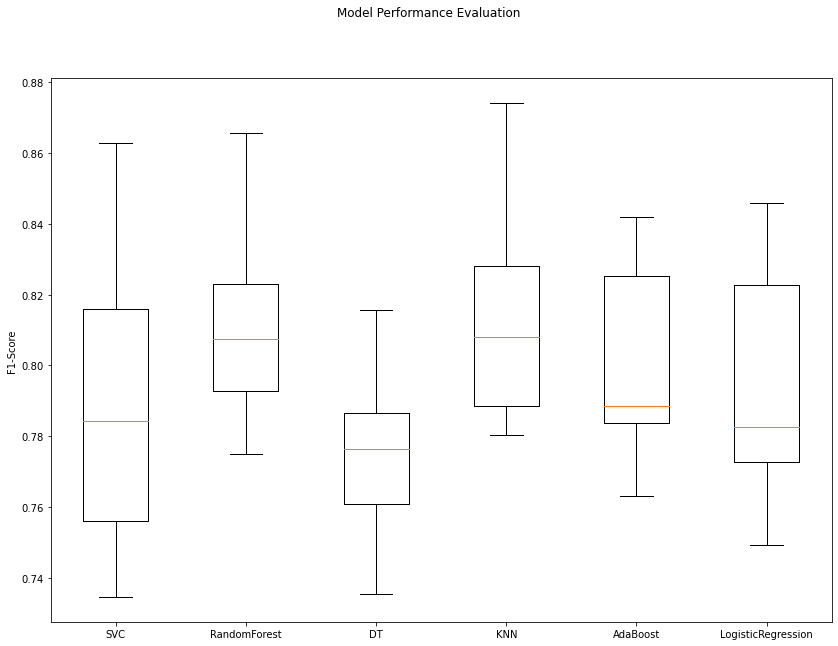
From the above plot and the F1 scores I can conclude that the k-nearest neighbors classifier is working the best in most of the n-fold results. Hence we will fine tune the KNN classifier for achieving better predictions.
I will be testing various combinations of the parameters 'algorithm', 'metric' and the 'n_neighbors' and for different values to get the best set of parameters. And again I will be using the k-fold Cross Validation strategy to ensure the validity of results of the experiments. After testing for various combinations of parameters the best set of parameters were found to be : {'algorithm': 'ball_tree', 'metric': 'manhattan', 'n_neighbors': 3} Now I will move on to train a KNN classifier with the best parameters to make predictions for the quality of wine.
I have trained a KNN classifier that predicts the quality of wine with the best set of parameters. The model can predict the quality of wine with an accuracy score of 0.8136 which is a 30% improvement over our baseline linear regression model.
- The code is designed to save the model predictions into a csv file.
In this project I have performed an EDA on the wine quality dataset, performed data cleaning, outlier detection, variable encoding, data standardization, model testing, parameter tuning and model building for predicting the quality of wine along with lucid visualizations to better understand the data and results.
In the future I would like to extend this model to be able to predict the prices of the wine and I would also like to collect more data for improving the performance of the model.