This project demonstrates the ability to run MongoDB Atlas Charts visualisations against data held in both your cluster and a Datalake
Time to setup: 45 mins
Time to execute: 15 mins
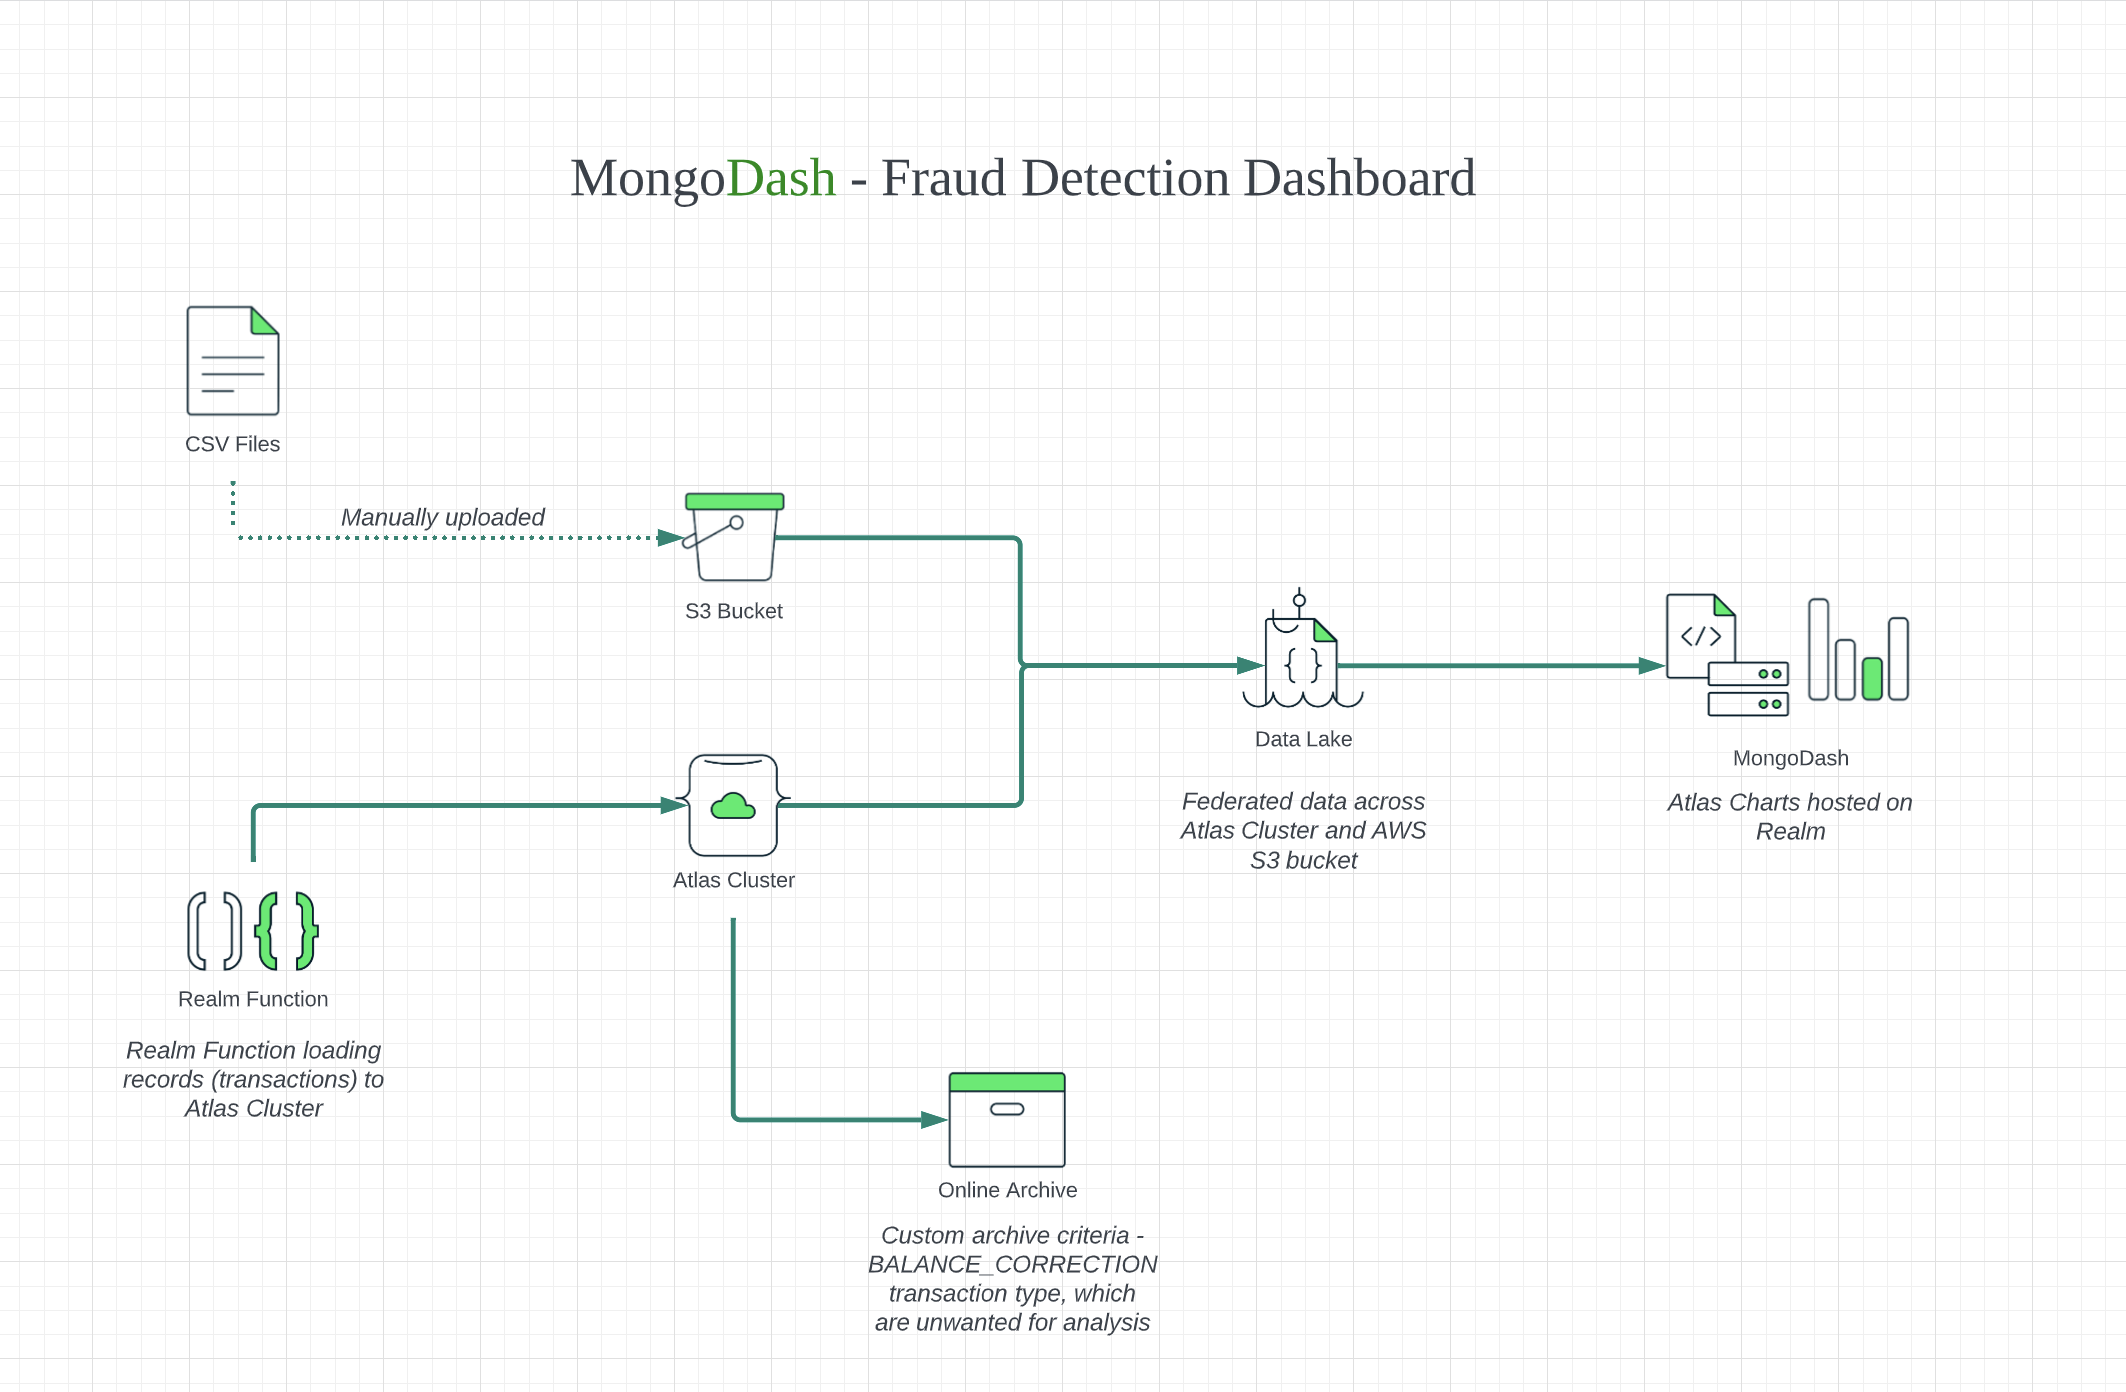
This proof shows how MongoDB can federate queries to multiple data sources in order to build visualizations through Atlas charts. This proof makes use of a financial dataset of 1,000,000 documents representing different kinds of transactions, both fraudulent and legitimate. This data will be federated from both the Atlas cluster and an attached Data Lake.
Visualtizations can include:
- Transaction count
- Transaction by origin country
- Overall transaction by month
- Fraud flag confusion matrix
The 1,000,000 records are retrieved from a publicly available dataset and split between and Atlas cluster and an S3 bucket for datalake. The charts will allow visualizations to be returned against both data sources simultaneously
1. Configure Atlas Cluster
- Log-on to your Atlas account (using the MongoDB SA preallocated Atlas credits system) and navigate to your SA project
- In the project's Security tab, choose to add a new user called main_user, for this user select Add Default Privileges and in the Default Privileges section add the roles readWriteAnyDatabase and clusterMonitor (make a note of the password you specify)
- Create an M20 based 3 node replica-set in a single AWS region of your choice with default storage settings (backup can be disabled).
2. Create Relevant Charts
- Using your Atlas account, navigate to the Charts tab and create a new dashboard
- Within this dashboard, select 'add chart' and begin to add relevant charts to the dashboard reflecting the metrics that you require
- Examples of possible charts include:
- Fraud Transactions by Origin Country
- Transactions by Month
- Accuracy of fraud detection
- Fradulant transaction amount
3. Configure Realm Application
- Ensure you have forked the main branch of this repo
- Add your chart embed link to the codebase and run 'npm run build'
- In your Atlas account, navigate to the Realm tab
- Select 'Create a New App' and enter the relevant information
- In the left pane, navigate to the hosting tab and click 'enable hosting'
- Select 'Upload Files' and upload the files within your local build folder
4. Configure Realm Function
- In your Atlas account, click on the Realm tab
- Navigate to your realm application that you previously configured
- In the left pane, click on the functions tab and create a new function
- Enter the name 'insertRandom' and leave all other settings as default
- Paste the insert script into the function editor and click save
5. Configure AWS S3 Bucket
- Using your MongoDB 'Solution Architects' AWS pre-existing account, log on to the AWS console and near the top right hand side of the AWS Console, change the region to match the same AWS region as you created the Atlas cluster in Console
- Navigate to the S3 service within the AWS console and select 'Create bucket'
- Enter a name for the bucket and select the same region as your atlas cluster
- Add Tags: be sure to set the 3 specific tags ('Name', 'owner', 'expire-on') on your instance as per the MongoDB AWS Usage Guidelines to avoid your instance from being prematurely reaped
- All other options can be left as default
- Load the sample dataset into your S3 bucket
6. Configure Atlas Data Lake
- In your Atlas account, click on the Data Lake tab on the left side
- Select 'Configure a New Data Lake' and click on 'Connect Data'
- Choose AWS S3 as a data source and follow the configuration instructions to connect your S3 bucket to Atlas Data Lake
7. Configure Online Archive
- In your Atlas account, navigate to your cluster and select the online archive tab
- Select 'Configure Online Archive' and select 'Custom Criteria' under archiving rule
- Paste the following rule into the custom criteria to archive specific kinds of transactions: {"type": "BALANCE_CORRECTION"}
1. Trigger the data import
- Launch the Realm App and select the "Start inserts" button
- Allow the import script to run for at least 10 seconds
- Observe the data being updated on the charts in real time
Once the import script has run for some time, observe the information displayed on the charts and how it has changed from the initial state. We can see as data is continuously loaded into the cluster by the script, we have new information made available via our visualizations. These can include trends of fraudulant activity from specific countries/regions and patterns in transactions that may be flagged as fraudulant but are in fact legitimate.