KydLIB is a Python module that provides tools for exploratory data analysis. It is specially designed to work with time series data typically obtained from process system engineering (PSE) applications, although it can also be useful for many types of data.
There are methods for analyzing and visualizing:
- linear and nonlinear pair correlations;
- autocorrelations;
- signal-to-noise ratios;
- multivariate Gaussianity.
For details on methodologies and application examples, see:
- Melo et al. (2022): Open benchmarks for assessment of process monitoring and fault diagnosis techniques: A review and critical analysis. doi:10.1016/j.compchemeng.2022.107964.
- Laarne et al. (2021): ennemi: Non-linear correlation detection with mutual information. doi:10.1016/j.softx.2021.100686.
- Zhang et al. (2016): A Novel Strategy of the Data Characteristics Test for Selecting a Process Monitoring Method Automatically. doi:10.1021/acs.iecr.5b03525.
- Feital and Pinto (2015): Use of variance spectra for in-line validation of process measurements in continuous processes. doi:10.1002/cjce.22219.
pip install kydlib
conda install -c conda-forge kydlib
Let's download a dataset from the Tennessee Eastman Process benchmark to serve as an example:
import pandas as pd

url = 'https://raw.githubusercontent.com/camaramm/tennessee-eastman-profBraatz/master/d00_te.dat'
df = pd.read_csv(url, delim_whitespace=True, header=None).iloc[:,:22]
To use KydLIB, we must instantiate a Study object providing the data to be analyzed:
import kydlib

s = kydlib.Study(df)
We are now ready to do the exploratory data analysis.
s.lineplot()
s.scatterplot()
s.corr_coef()
s.corr_coef_plot()
s.autocorrelation()
s.autocorrelation_plot()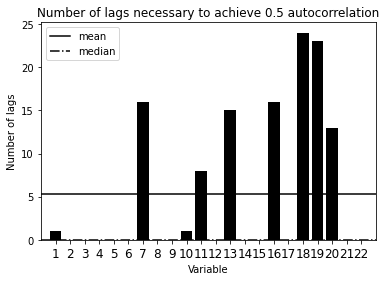
s.signal_to_noise()
s.signal_to_noise_plot()
s.gaussianity()
s.gaussianity_plot()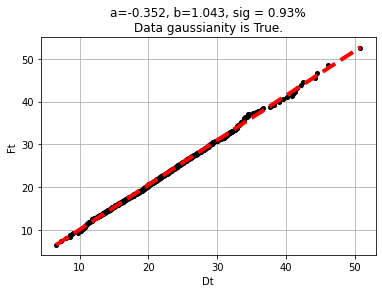
If this package has helped you in your research, consider citing:
@article{melo_open_2022,
  title = {Open benchmarks for assessment of process monitoring and fault diagnosis techniques: A review and critical analysis},
  journal = {Computers \& Chemical Engineering},
  volume = {165},
  pages = {107964},
  year = {2022},
  doi = {10.1016/j.compchemeng.2022.107964},
  author = {Melo, Afrânio and Câmara, Maurício M. and Clavijo, Nayher and Pinto, José Carlos}
}