Custom control add-ins for Business Central enriching the user experience with JavaScript UI components. Currently the repository contains three components:
- GraphViewControl: the base application that implements the GraphView control add-in. This is the base layer for other extensions which add more application-specific functionality.
- CostGraph: Extends the graph view control presending item ledger applications in a visual graph layout;
- RoutingGraph: Another extension on top of the graph view control. Visual presentation of production routings which enables more intuitive editing of complex routings.
Graph image is rendered by the Cytoscape package (https://cytoscape.org/). Besides Cytoscape, the GraphViewControl add-in uses PopperJS (https://popper.js.org/) and Tippy.js (https://atomiks.github.io/tippyjs/) to display tooltips on graph nodes. Edge editing functionality is facilitated by the cytoscape-edghandles package (https://github.com/cytoscape/cytoscape.js-edgehandles). All the dependencies are packed and minified by the Webpack bundler, so the control add-in loads a single .js file from the /Scripts/dist folder. To build the BC extension from the repository, follow these steps.
- Clone the repository
- Make sure that the Node.js package manager (npm) is installed in your system or install it: https://nodejs.org/en/download
- Navigate to the GraphViewControl source folder (cd "<Your repo root>/BCVisuals/GraphViewControl")
- Run the command npm i - this will install all dependencies
- Run the command npx webpack
That's it. npm will take care of all dependencies. File main.js, the entry point of the control add-in, is placed in the /dist folder. Now you can run Visual Studio Code and build the AL project.
A control add-in which traces cost sources for an item ledger entry and displays the cost graph in a convenient way, easy to grasp. Graph representation helps in understanding the cost applcations when a deeper cost analysis is required.


By default, all graph nodes are rendered with the same predefined style, while it may be useful to apply different styles to differentiate various types of entries. For example, highlighting all negative entries in a distinct colour is very helpful in understanding the positive to negative cost flow. Similarly, the cost application graph is easier to read when different entry types are drawn as different shapes. This visual differentiation can be achieved by configuring graph selectors and styles. Import the configuration package PackageGRAPHVIEW.rapidstart from the Config folder to see an example of the style configuration.


This application simplifies routing setup in Business Central by enabling visual editing of the operations sequence. Drag and drop routing edges to connect operations instead of entering next and previous operations manually. When the edits are saved, the fields "Next Operation No." and "Previous Operation No." in all routing lines are updated to reflect the changes.
To use this functionality:
-
Install the applications GraphViewControl and RoutingGraph
-
Import the configuration package from the Config folder of the repository. This package includes settings for node styles and tooltips which will be helpful when analysing and editing the graph
-
Select the routing you want to edit and open the routing card
-
From the routing card, run Routing -> View as Graph
-
By default, the graph layout opens in a view-only mode. Click Edit to enable editing (Note: certified routings cannot be edited. Routing must be in the New or Under Development status to enable editing)
-
In the Edit mode, drag and drop actions create new graph edges connecting routing operations. You can delete an edge by right-clicking on it.
-
Once all edits are done, push Save and close the page

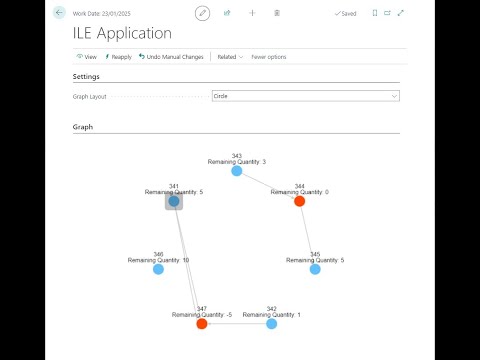
Graph representation of the application worksheet is a part of the CostGraph extension. It can be accessed from the standard Business Central application worksheet and employs the same functionality, replacing the table-based presentation of the item ledger with the graph view.
To access the graph-based application worksheet, open the Application Worksheet page, apply the necessary filters, and run the View as Graph action.

To start editing applications, switch the page to the Edit mode. Remove applications between entries with the right-click on a graph edge and define new applications with a simple drag and drop action.