![]()

$ pip install zmapioimport matplotlib.pyplot as plt
import numpy as np
from zmapio import ZMAPGrid%matplotlib inlineReading a ZMAP file:
z_file = ZMAPGrid('./examples/NSLCU.dat')Accessing the comments header:
for c in z_file.comments:
    print(c)
Landmark Zmap grid file name: .DATANSLCU.dat Created/converted by Oasis Montaj, Geosoft Inc.
Plotting the grid data:
z_file.plot()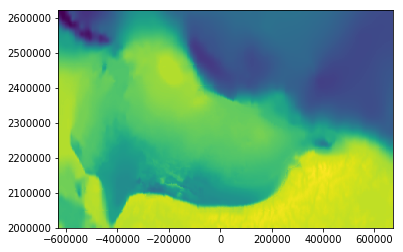
Counts for rows and columns:
z_file.no_cols, z_file.no_rows(435, 208)
Shape for z-values:
z_file.z_values.shape(208, 435)
Exporting to CSV file:
z_file.to_csv('./output/output.csv')head ./output/output.csv-630000.0,2621000.0,-16481.9570313 -630000.0,2618000.0,-16283.9033203 -630000.0,2615000.0,-16081.5751953 -630000.0,2612000.0,-15856.7861328 -630000.0,2609000.0,-15583.7167969 -630000.0,2606000.0,-15255.734375 -630000.0,2603000.0,-14869.3769531 -630000.0,2600000.0,-14426.1513672 -630000.0,2597000.0,-13915.8769531 -630000.0,2594000.0,-13340.4677734
Exporting to WKT file:
z_file.to_wkt('./output/output.wkt', precision=2)Exporting to GeoJSON file:
z_file.to_geojson('./output/output.json')Exporting to Pandas Dataframe:
df = z_file.to_dataframe()df.Z.describe()count 90480.000000 mean -5244.434235 std 4692.845490 min -16691.371094 25% -10250.590088 50% -4003.433105 75% -1320.896881 max 2084.417969 Name: Z, dtype: float64
Write a new ZMAP file as 3 nodes per line format:
z_file.write('./output/test.zmap', nodes_per_line=3)head ./output/test.zmap! Landmark Zmap grid file name: .DATANSLCU.dat ! Created/converted by Oasis Montaj, Geosoft Inc. @.DATANSLCU.dat, GRID, 3 20, 1e+30, , 7, 1 208, 435, -630000.0, 672000.0, 2000000.0, 2621000.0 0.0, 0.0, 0.0 @ -16481.9570313 -16283.9033203 -16081.5751953 -15856.7861328 -15583.7167969 -15255.7343750 -14869.3769531 -14426.1513672 -13915.8769531
Creating a ZMAP object from string:
z_text = """
!
! File created by DMBTools2.GridFileFormats.ZmapPlusFile
!
@GRID FILE, GRID, 4
20, -9999.0000000, , 7, 1
6, 4, 0, 200, 0, 300
0.0, 0.0, 0.0
@
       -9999.0000000       -9999.0000000           3.0000000          32.0000000
          88.0000000          13.0000000
       -9999.0000000          20.0000000           8.0000000          42.0000000
          75.0000000           5.0000000
           5.0000000         100.0000000          35.0000000          50.0000000
          27.0000000           1.0000000
           2.0000000          36.0000000          10.0000000           6.0000000
           9.0000000       -9999.0000000
"""
z_t = ZMAPGrid(z_text)
z_t.plot()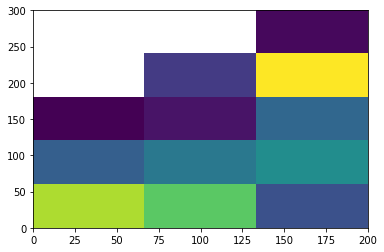
Adding colorbar and colormap using matplotlib:
z_obj = ZMAPGrid('./examples/NStopo.dat')
fig=plt.figure(figsize=(12, 6))
z_obj.plot(cmap='jet')
plt.colorbar()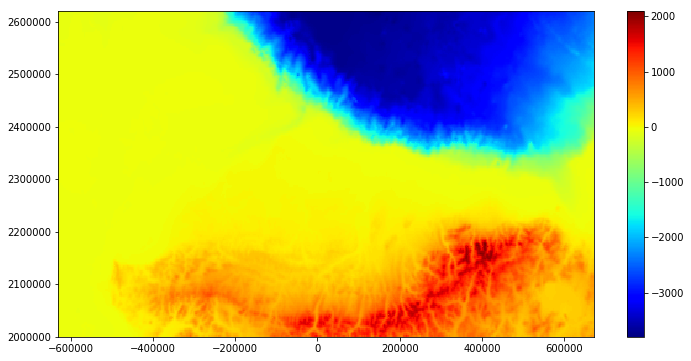
Creating a new ZMAP object from 2D-Numpy array with shape (no_cols, no_rows):
z_val = z_obj.z_values
print('Z-values shape: ', z_val.shape)
new_zgrid = ZMAPGrid(z_values=z_val, min_x=-630000.0000, max_x=672000.0000,
                     min_y=2000000.0000,  max_y=2621000.0000)
Z-values shape: (435, 208)
new_zgrid.plot(cmap='gist_earth')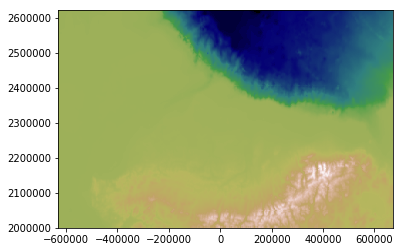
Customize writing a ZMAP file:
new_zgrid.comments = ['this is', 'a test']
new_zgrid.nodes_per_line = 4
new_zgrid.field_width = 15
new_zgrid.decimal_places = 3
new_zgrid.name = 'test'
new_zgrid.write('./output/new_z.dat')
head ./output/new_z.dat!this is !a test @test, GRID, 4 15, 1e+30, , 3, 1 208, 435, -630000.0, 672000.0, 2000000.0, 2621000.0 0.0, 0.0, 0.0 @ -67.214 -67.570 -67.147 -69.081 -73.181 -74.308 -72.766 -72.034 -70.514 -68.555 -66.195 -62.776
- https://lists.osgeo.org/pipermail/gdal-dev/2011-June/029173.html
- https://gist.github.com/wassname/526d5fde3f3cbeb67da8
- Saltus, R.W. and Bird, K.J., 2003. Digital depth horizon compilations of the Alaskan North Slope and adjacent arctic regions. U.S. Geological Survey data release: https://doi.org/10.3133/ofr03230