- The architecture typically describes the buiding of a datalake for the storage of all forms of data that can be extracted from an open source kaggle repository on the internet. Typically, there are two possible scenarios:
-
- Batch Data
-
- Streaming Data
This project is concerned with ingesting batch data from source by using python scripts and preparing it is such a way that would be easy to extract and display information on a data analytics tool Microsoft PowerBi.
We had to exclude the streaming data because there was no correlation between the weather conditions in France and the Covid-19 data.
The project is a typical ETL procedure

- The data used for this project is a dataset on Covid-19. It is a dataset that is located at and curled from the url https://www.kaggle.com/hgunraj/covidxct. It is a 29GB data that containes the following files in a zip: 2A_images metadata.txt test_COVIDx_CT-2A.txt train_COVIDx_CT-2A.txt Val_COVIDx_CT-2A.txt
The Images folder contains images of patients brains who at the time of taking covid tests, either have pneumonia, Covid-19 or normal. For each patient, we have several intrinsic information such as Country, age, sex, disease type (normal, covid or Pneumonia) all linked to the patient ID
- Data ingestion was done by running a python script on an Ubuntu 20.4 ec2 instance in Amazon cloud. To address cost, the ec2 instance used is within the free tier. However, to cater for the relatively huge data size, the storage on the server was increase in excess of required space. There was no requirement to upgrade the ec2 instance as it is a fresh installment from Amazon.
The EC2 instance was configured as follows:
-
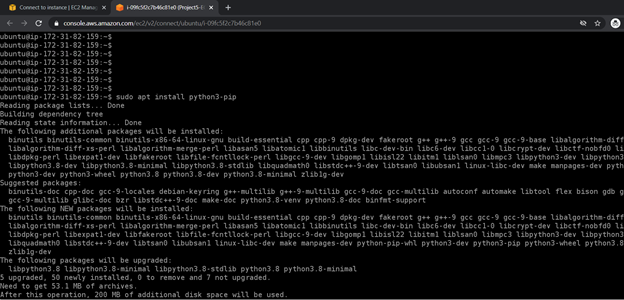
Update the instance by running: sudo apt-get update

-
Install pip sudo apt install python3-pip
-
Create a virtual env named Project5 python3 -m pip install virtualenv Virtualenv Project5
-
Install Boto3 and Kaggle Libraries pip install boto3 pip install kaggle
The python script written does the following:
- Extract the zip files
- Merge the content of the txt file before uploading into the s3 datalake.
The process of extractions and merging required that the data be first uploaded to storage on the ec2 instance, perform the transformation process before uploading the files into s3 bucket. This is because data manipulation in s3 is more complicated.
The error below is typical of data extraction from Kaggle:

ubuntu@ip-172-31-82-159:~/Project5$ python3 project.py Traceback (most recent call last): File "project.py", line 1, in from kaggle.api.kaggle_api_extended import KaggleApi File "/home/ubuntu/.local/lib/python3.8/site-packages/kaggle/init.py", line 23, in api.authenticate() File "/home/ubuntu/.local/lib/python3.8/site-packages/kaggle/api/kaggle_api_extended.py", line 164, in authenticate raise IOError('Could not find {}. Make sure it's located in' OSError: Could not find kaggle.json. Make sure it's located in /home/ubuntu/.kaggle. Or use the environment method.
This error is easily taken care of by downloading the kaggle json file and saving it into the root directory of the ec2 instance /home/ubuntu The json file is needed to establish connection to kaggle before any data can be extracted.
After unzipping and merging the files, the data is then uploaded to s3 and the update is seen realtime:
During uploading of the files to S3, about 126,000 files were uploaded out of about 196,000 files. This accounts for about 64% success rate. The huge failure experienced was due to the low compute power of the ec2 instance which resulted to throtling during the processing. The free tier ec2 instance runs about 300 iops. To resolve this, the python code was redesigned to go into the folder, make comparison with successful upload and upload the differential:

This resulted to the uploading of the remaining missing files:

- Now that all the data has been moved to s3, we now have a datalake from which we are set to extract useful information to display on PowerBi. To achieve this, there is a need to install a connector for PowerBI to S3. Establishing a connection between the s3 and PowerBi allows us search for needed information from the datalake and displaying same in powerBi.
