Visualizing changes in land prices in New Jersey, using data from the Federal Housing Finance Agency. I tweeted about this project here. More states might be coming soon.
Data on county-level land prices come from the Federal Housing Finance Agency, and can be downloaded directly here (Warning: .xlsx). There is also a ZIP code-level dataset within that Excel workbook (Note: Actual ZIP codes, not ZCTAs). Maybe one day I'll muster the energy required to make a ZIP code-level map. Until then, any enterprising person reading this is welcome to beat me to it.
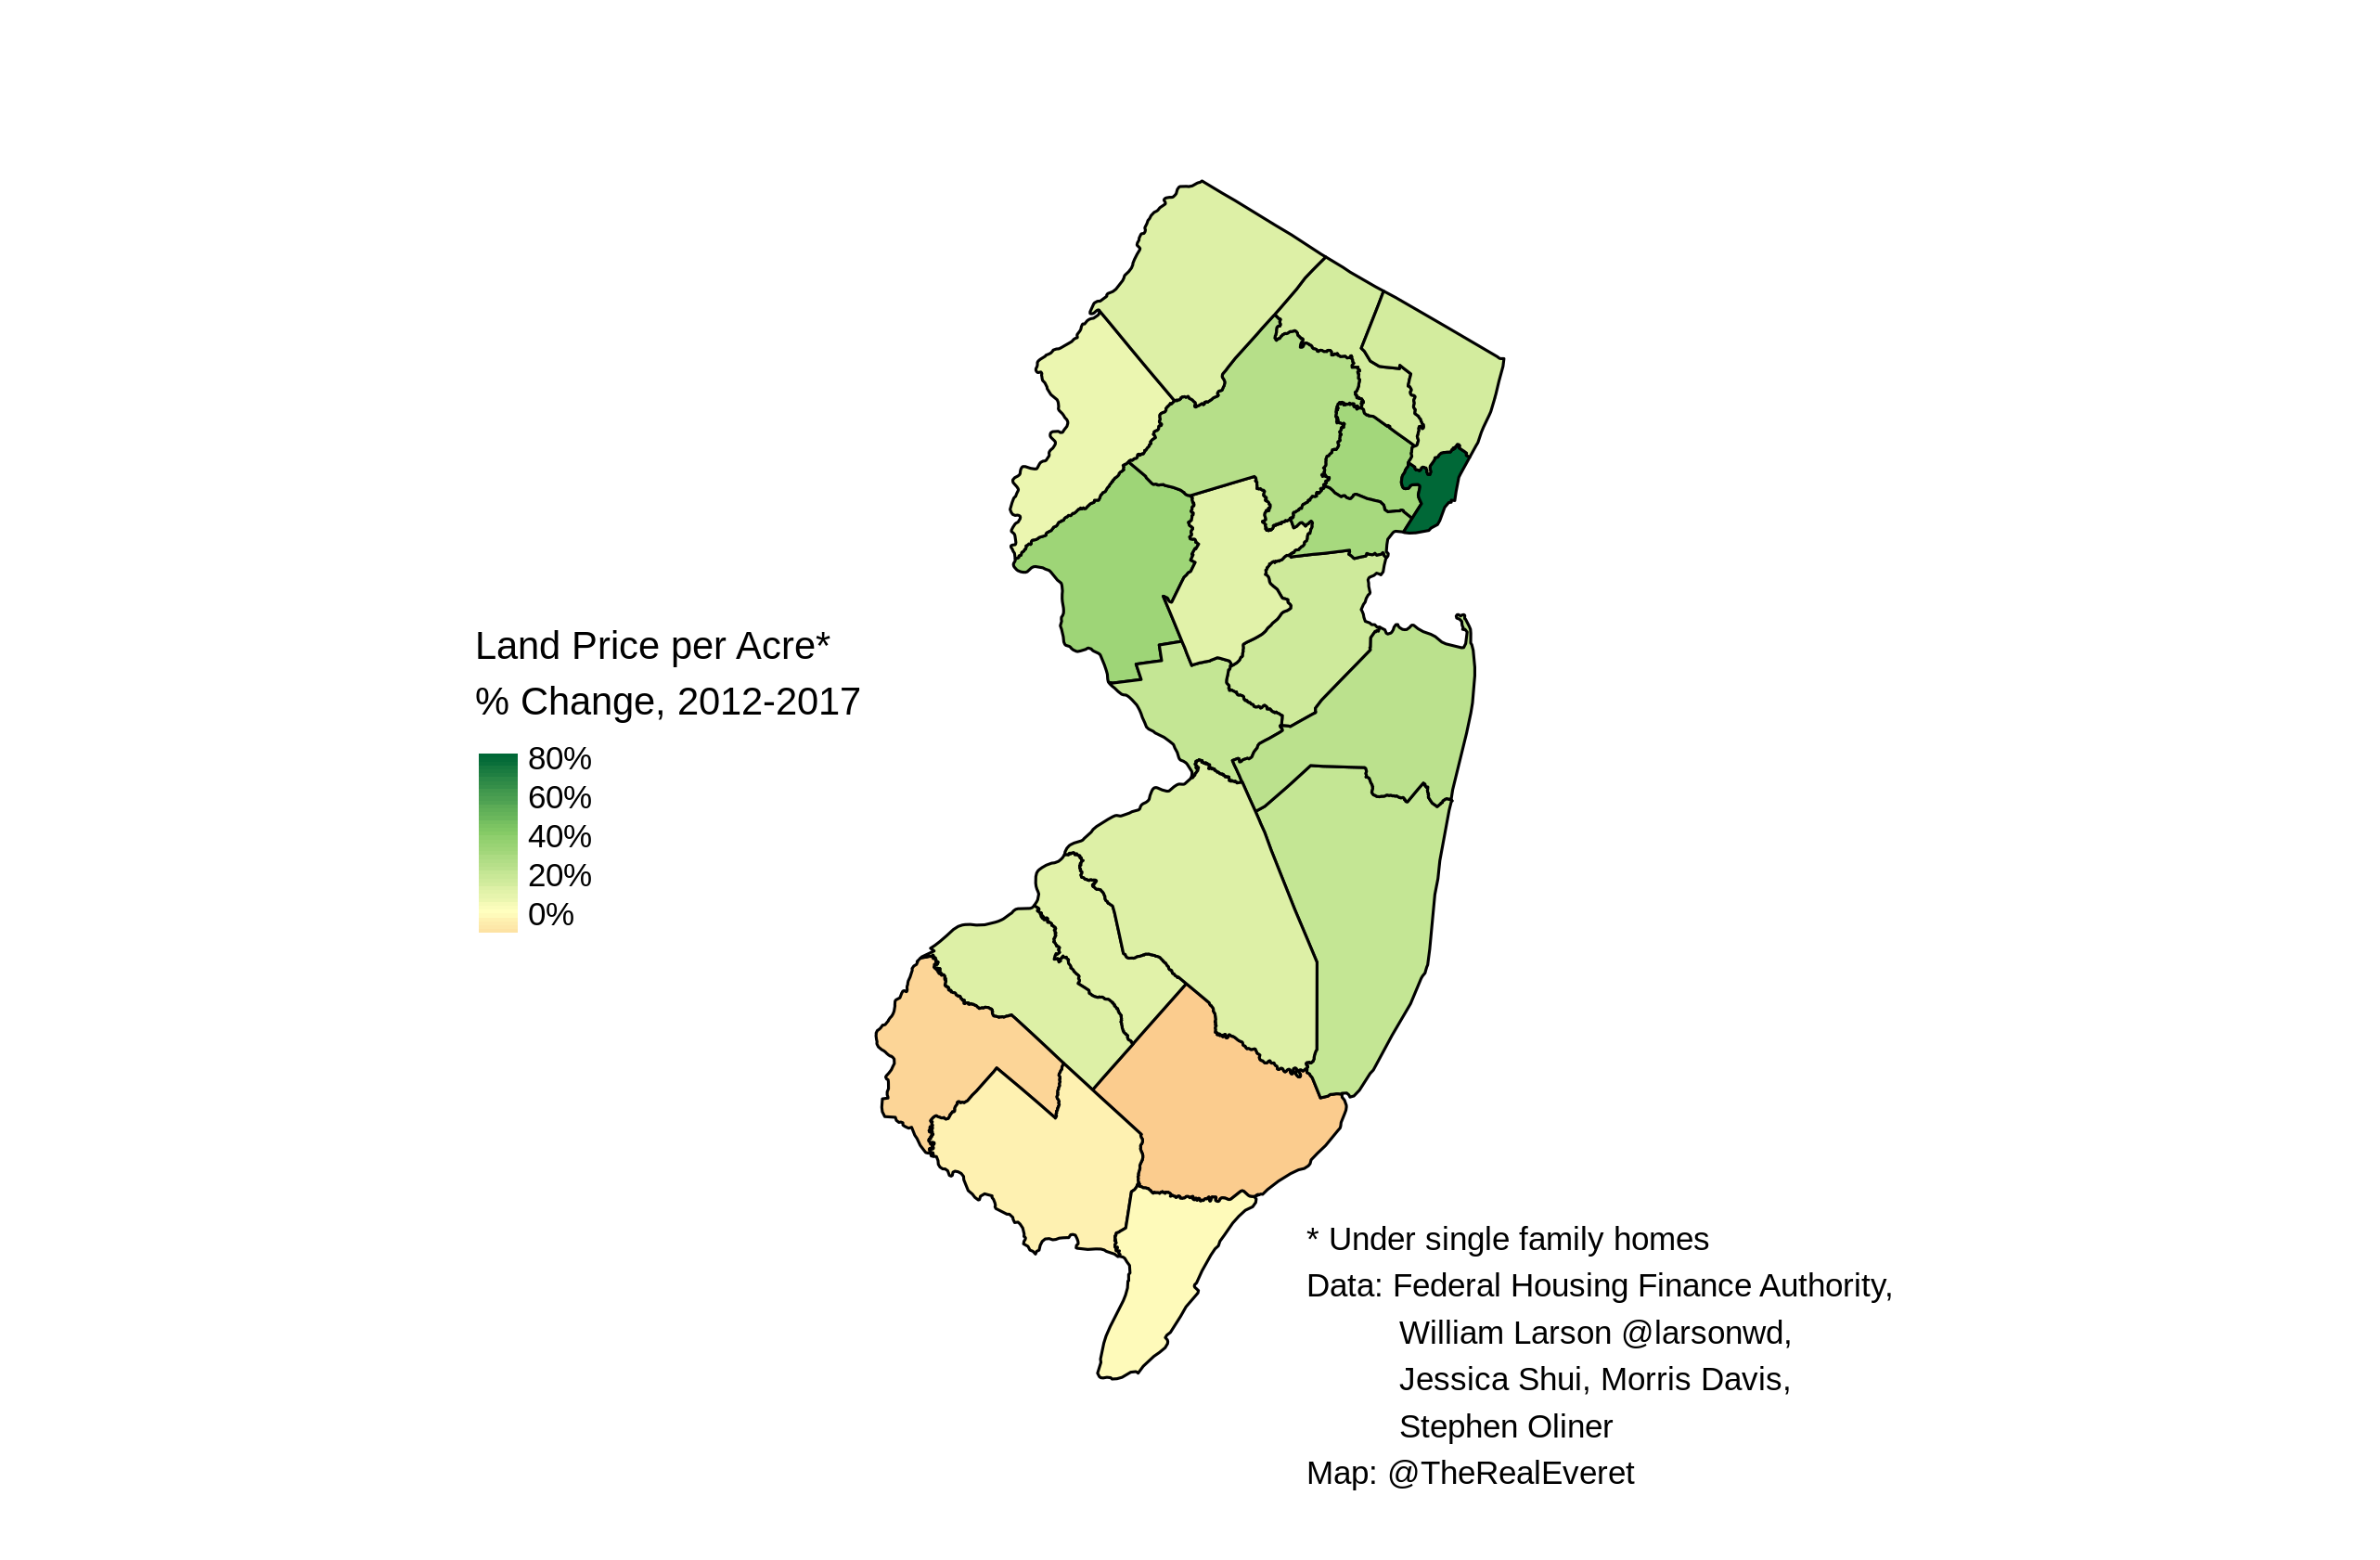
I calculated "% Change in Land Prices 2012-17" for each county as follows:
(L_2017 / L_2012) * 100
Where L_2017 is county-level aggregate land price per acre in 2017, and L_2012 is the same for 2012.
The dataset which includes my calculations, and which was used to generated all
graphics in this project, is in data/base/Land-Prices_DLOS_2019-January.xlsx.
Any errors in this dataset or my code are solely mine.
Map shows county-level % changes in land price per acre, only on land that lies under single-family homes.
Larson, W., Shui, J., Davis, M., & Oliner, S. (2019). The Price of Residential Land for Counties, ZIP codes, and Census Tracts in the United States (Working Paper 19-01). Washington: Federal Housing Finance Agency. https://www.fhfa.gov/PolicyProgramsResearch/Research/Pages/wp1901.aspx
Generated by R/map_counties.R. The PNG lives in graphics/NJ_counties_landprice.png. You can find the values for each county
in data/base/Land-Prices_DLOS_2019-January.xlsx.
All of my original code is licensed under the General Public License, Version 3 (GPLv3).
All of my non-code original content, including but not limited to text and graphics, are licensed under the Creative Commons Attribution-ShareAlike 4.0 International License (CC BY-SA 4.0).